

A CMMS API lets maintenance software talk directly to your ERP, IoT sensors, and inventory systems, replacing manual data entry with automatic, real-time updates to work orders, assets, and stock levels. Maintenance, operations, and IT teams all benefit from the shared visibility this creates. The immediate next step is straightforward: audit your existing systems and open your CMMS vendor’s developer documentation to see what’s actually possible.
En resumen:
- Setting up a CMMS API typically takes between four to eight weeks, with discovery and requirements mapping lasting one to two weeks.
- Prioritizing integrations with ERP and inventory systems first provides the most immediate benefit by linking maintenance to financial and supply chain data.
- Webhooks are better suited than polling for real-time alerts like breakdowns, while polling can handle less urgent updates such as daily asset reconciliations.
- Building a maintainable API integration requires canonical IDs, versioned endpoints, and thorough monitoring to avoid breakdowns after the initial deployment.
- Using vendor resources like OpenAPI specifications and SDKs speeds up development and helps prevent silent API changes that could disrupt workflows.
Índice
- What is a CMMS API and how does it fit into maintenance workflows?
- Which systems should you connect to your CMMS first?
- What technical components does a CMMS API integration need?
- How long does a CMMS API integration actually take?
- What separates a maintainable integration from a fragile one?
- How do work order sync, inventory flow, and telemetry integration work in practice?
- What developer resources make CMMS API integration faster?
- Notes from the field on CMMS integration projects
- Where FullyOps fits in your integration plan
- Sources
- PREGUNTAS FRECUENTES
What is a CMMS API and how does it fit into maintenance workflows?
An API for maintenance management is a defined set of rules that lets your CMMS exchange data with other software without a human copying figures between screens. Most CMMS platforms today use REST APIs with JSON as the exchange format, the same combination that powers the vast majority of modern business software. A request goes out, a response comes back, structured as readable key value pairs rather than a proprietary file format nobody else can parse.
Two mechanisms handle the actual data movement, and they solve different problems.
- Polling means your system asks the CMMS at intervals, “anything new?” It’s simple to build but wastes calls when nothing has changed.
- Webhooks flip that around: the CMMS pushes a notification the instant something happens, a work order closes, a part drops below threshold, an asset status changes.
Webhooks suit high-frequency, time-sensitive events like breakdown alerts. Polling still works fine for low-urgency syncs, like a nightly asset list reconciliation.
The payoff shows up in numbers maintenance managers actually track. Removing manual re-entry between systems cuts the delay between a fault being logged and a technician being dispatched, which shortens mean time to repair. It also removes the transcription errors that creep in when someone retypes a part number or asset ID between two disconnected screens, and it gives finance and operations a single, trustworthy data source for reporting instead of three spreadsheets that never quite agree.
Which systems should you connect to your CMMS first?
Not every integration delivers equal value, and trying to connect everything at once is how projects stall. Prioritise based on where manual work currently causes the most friction or the most risk.
- ERP and finance systems — synchronising asset registers and maintenance costs means your finance team sees real spend against real equipment, not estimates reconciled at quarter end.
- IoT and telemetry platforms — sensor data feeding directly into your CMMS turns condition monitoring into automatic work order triggers, the foundation of predictive maintenance rather than reactive firefighting.
- Business intelligence tools — pulling work order, downtime, and cost data into a BI platform gives operations leaders one dashboard instead of exporting CSVs from five different systems every Monday.
- Inventory and procurement systems — linking spare parts stock to your CMMS means a work order that consumes a part can trigger a reorder automatically, closing the loop between maintenance activity and supply chain.
- HR, rostering, and mobile apps — syncing technician availability and skills data ensures work orders route to whoever is actually on shift and qualified, rather than whoever picks up the tablet first.
Manufacturing teams connecting shop floor equipment often draw on established machine data protocols. A CNC integration pilot using MTConnect and OPC UA shows how telemetry standards can feed maintenance systems without custom point-to-point wiring for every machine type.
What technical components does a CMMS API integration need?
Before writing a single line of integration code, get familiar with the endpoints and data conventions your CMMS actually exposes. Most platforms follow a recognisable pattern.
- Assets — create, read, update endpoints for equipment records, hierarchies, and status.
- Órdenes de trabajo — the core object: creation, assignment, status updates, and closure.
- Spares and inventory — stock levels, part records, and consumption against work orders.
- Users and permissions — technician records, roles, and access scopes.
- Schedules — preventive maintenance calendars and recurring task definitions.
The EV Service Manager REST API illustrates this well, exposing methods like GET /requests and POST /requests alongside configuration item endpoints, all exchanged as JSON over HTTP.
Data modelling causes more integration failures than authentication does. Canonical IDs matter: if your ERP and CMMS both generate their own asset numbers, you need a mapping table or a shared identifier from day one, not after the first duplicate record appears. Timestamps and time zones deserve equal attention, particularly for multi-site operations where a “created at” field recorded in UTC needs correct local conversion for shift reporting.
Authentication typically follows one of four patterns: static API keys, bearer tokens, full OAuth 2.0 flows, or basic authentication, always over TLS-encrypted connections. Vendor portals such as SGMAN’s API documentation publish token-based examples and Postman collections specifically to shorten this setup phase. Watch also for rate limits, which throttle how many calls you can make per minute, and build idempotent operations so a retried request never creates a duplicate work order. Handle HTTP error codes properly too; a 400 means your request was malformed, a 500 means the problem sits on the CMMS side.
How long does a CMMS API integration actually take?
Realistic timelines beat optimistic ones, and most integration failures trace back to skipped discovery work rather than coding problems.
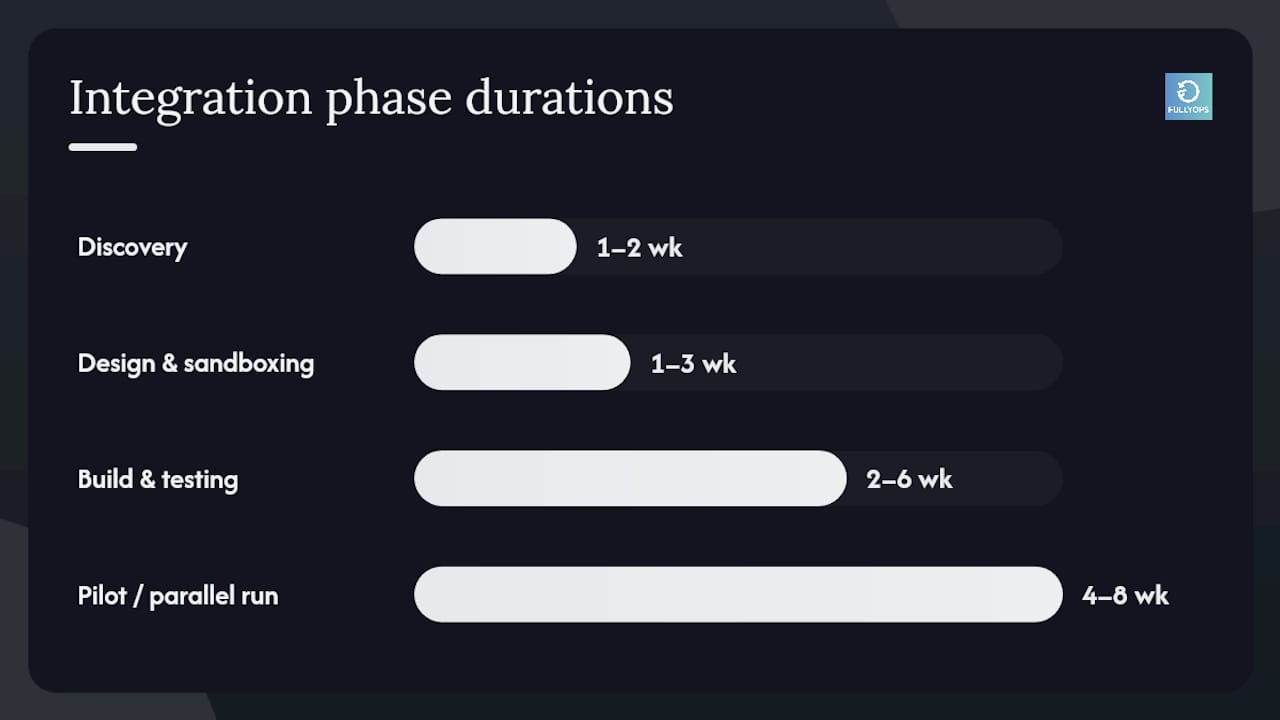
- Discovery and requirements mapping (1 to 2 weeks) — document which systems need to talk, what data flows between them, and who owns each field.
- Design and sandboxing (1 to 3 weeks) — map data fields between systems and test calls against a sandbox environment before touching production data.
- Build and integration testing (2 to 6 weeks) — develop the actual connectors, testing each endpoint against real scenarios, not just happy-path examples.
- Pilot or parallel run (30 to 60 days recommended) — run the new integration alongside existing manual processes so discrepancies surface before you cut over completely.
- Monitoring and incremental cutover — move one site, one asset class, or one workflow at a time rather than flipping every system simultaneously, with a clear rollback plan if something breaks.
An ERP integration built out over four to eight weeks is a reasonable benchmark for a mid-sized maintenance operation connecting core financial systems.
Consejo profesional: Run your parallel period long enough to catch a full maintenance cycle, including your slowest-moving preventive tasks. A two-week pilot might miss the monthly inspection that only reveals a data mapping error once a month.
What separates a maintainable integration from a fragile one?
The integrations that survive past year one share a handful of disciplined habits, and the ones that don’t usually skipped every one of them.
- Fix canonical identifiers before building anything. Decide which system owns the master asset ID, and map every other system’s reference to it.
- Build idempotent operations. A retried API call after a network timeout should never create a second, duplicate work order.
- Version your endpoints. Vendors update APIs; pin your integration to a stable version so an unannounced change doesn’t break production overnight.
- Instrument everything. Logs, sync success rates, and alerts on failed calls tell you an integration has silently stopped working before a technician notices missing data.
- Apply least privilege to API credentials. Rotate keys regularly, and scope each integration’s access to only the endpoints it actually needs.
Getting the webhook architecture right from the start avoids a common trap: teams build polling first because it’s simpler, then discover months later that alert latency is unacceptable for breakdown scenarios and have to rebuild.
How do work order sync, inventory flow, and telemetry integration work in practice?
Three workflows come up in almost every CMMS integration project, and mapping them out in advance saves weeks of back-and-forth during build.
- Work order sync: a trigger from a service desk ticket or a BI-defined rule calls the create endpoint, the CMMS assigns and tracks status, and updates flow back to the originating system on closure.
- Inventory and reorder flow: a technician logs parts used against a work order, stock drops below a defined threshold, and an automatic purchase request fires to the ERP or procurement system.
- Telemetry to predictive work order: sensor data streams in, a rule engine evaluates it against thresholds, and a work order gets created and auto-assigned to the right technician without anyone watching a dashboard.
Each pattern follows the same underlying logic: a trigger, a CMMS action, and a confirmation loop back to the source system. Getting comfortable with digital work order workflows on mobile devices makes the technician-facing side of this considerably smoother.
What developer resources make CMMS API integration faster?
Request an OpenAPI or Swagger specification from your CMMS vendor before writing any code. It gives you a machine-readable map of every endpoint, and it plugs straight into Postman for sandbox testing without manual guesswork. Where a vendor offers client SDKs, use them over raw HTTP calls; they handle authentication headers and error parsing for you. For richer reporting downstream, JSON-LD adds semantic structure that helps BI tools interpret relationships between assets and events. Finally, build automated contract tests early, they catch a vendor’s silent API change before it breaks your production sync.
Notes from the field on CMMS integration projects
Pilot timing separates smooth rollouts from painful ones. Integration work resembling an ERP pilot compressed into two to four weeks followed by a 30 to 60 day parallel run tends to surface data mapping issues while they’re still cheap to fix. The surprises are rarely dramatic: a timezone mismatch, a custom field nobody documented, a rate limit hit during month-end reporting. None of it is exotic. Most of it is preventable simply by reading the developer docs before committing to a go-live date.
— Pedro
Where FullyOps fits in your integration plan
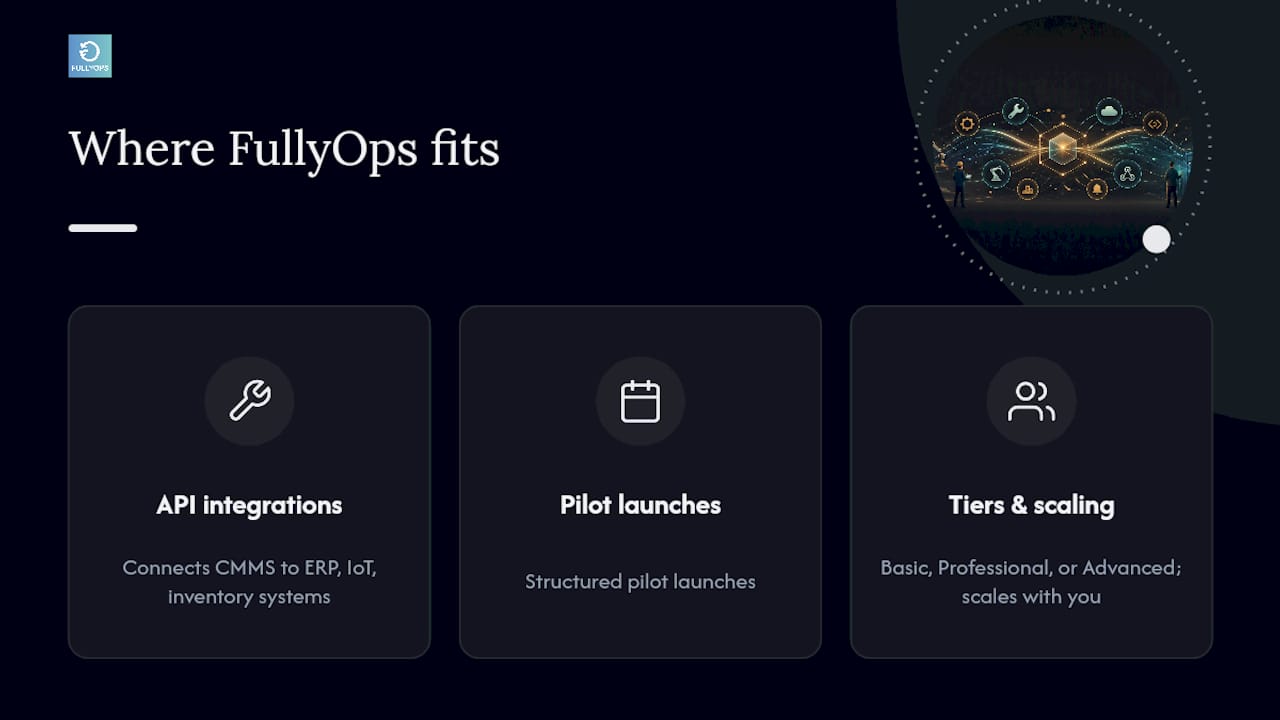
FullyOps is built for maintenance teams who need their CMMS talking to ERP, IoT, and inventory systems without stitching it together from scratch. The platform supports API-driven integrations, structured pilot launches, and phased migration approaches, so you’re not choosing between a fast rollout and a safe one. If you’re weighing an integration project against your current manual workflows, the practical next step is requesting an integration checklist or booking a demo to see how FullyOps’ plans handle your specific mix of assets, technicians, and connected systems. Whichever tier fits your operation, Basic, Professional, or Advanced, the underlying integration capability scales with you rather than forcing a rebuild later.
PREGUNTAS FRECUENTES
What is a CMMS system?
A CMMS, or computerised maintenance management system, is software that tracks work orders, assets, preventive maintenance schedules, and spare parts inventory for maintenance teams.
What does API stand for?
API stands for Application Programming Interface, a defined set of rules that lets two software systems exchange data and trigger actions in each other.
What are the four types of APIs?
The four common categories are open (public) APIs, partner APIs shared with specific business relationships, internal (private) APIs used within one organisation, and composite APIs that bundle multiple calls into a single request. Most CMMS integrations use partner or private APIs, secured with authentication such as API keys or OAuth 2.0.
What is an API in product management?
In product management, an API defines how a product’s data and functions are exposed to other software, letting a CMMS like FullyOps connect with ERP, IoT, or BI platforms without custom point-to-point code for every system.
How much does FullyOps cost?
FullyOps offers Basic, Professional, and Advanced plans, with current pricing available directly on the FullyOps website.