

TL;DR:
- A continuous eight-step performance analysis process improves maintenance decisions and replaces annual reviews. It involves goal alignment, reflection, data gathering, assessment, discussion, and documentation on a regular schedule. Fullyops supports this workflow through real-time dashboards, work order management, and analytics tools that enable proactive asset management.
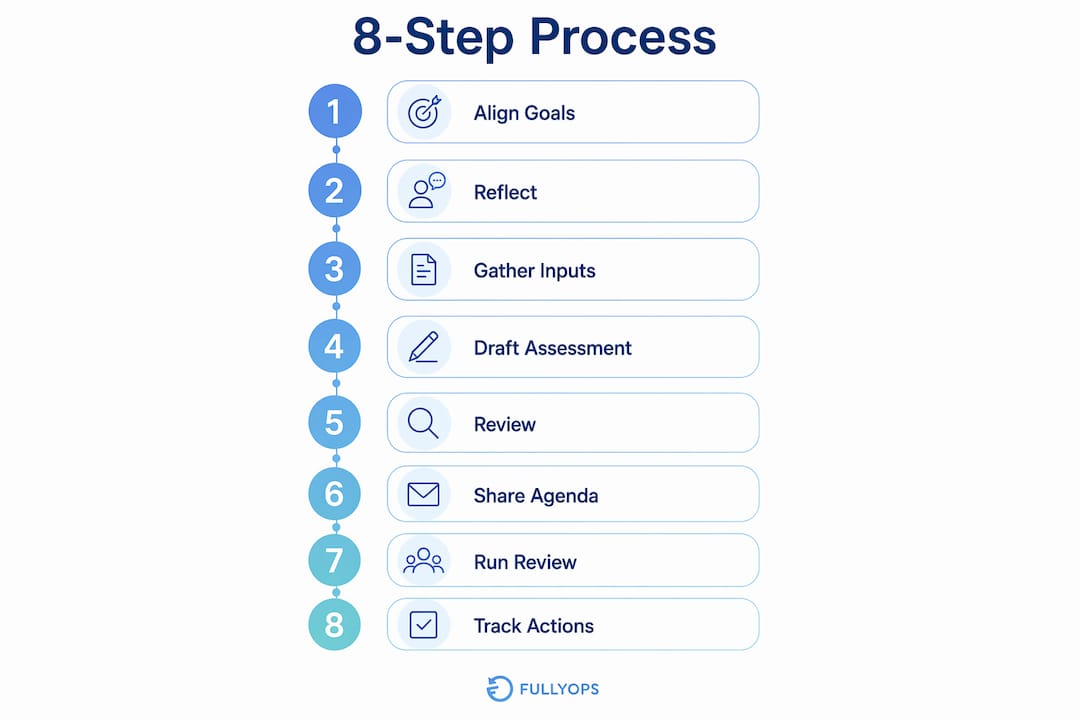
A repeatable, continuous 8-step performance analysis process delivers faster, safer, and more justifiable maintenance decisions than any annual review cycle. The eight steps are: align goals, conduct asset and team reflection, gather system and peer inputs, draft your assessment, review self-appraisal, share agenda, run a structured trajectory-focused discussion, and finalise documentation. Applied continuously across weekly, monthly, and quarterly cadences, this workflow transforms raw CMMS data into decisions your finance team can act on. ISO 55000 frames asset management as a discipline of planned, evidence-based decisions — this tutorial operationalises that principle for UK maintenance teams using cloud-based field service management (FSM) platforms.
Pro Tip: Start with one dashboard before redesigning your entire review process. A single planned-vs-unplanned hours chart, reviewed weekly, will surface more insight in 30 days than a quarterly spreadsheet reviewed annually.
Table of Contents
- Your 8-step performance analysis checklist
- Which KPIs actually tell you how your assets are performing?
- Where does reliable maintenance data actually come from?
- Practical analysis techniques that surface root-cause insight
- How to run a structured performance review meeting
- Turning analysis into prioritised actions and investment cases
- Recommended cadence, resourcing, and cost in a UK context
- Copyable templates: KPI glossary, agenda, and data-quality checklist
- Key takeaways
- Why continuous analysis changes what maintenance teams can actually do
- Fullyops helps you run the 8-step process from day one
- Further reading and authoritative sources
- FAQ
Your 8-step performance analysis checklist
Copy this into your next meeting invite or CMMS ticket template.
- Align goals — confirm which assets and KPIs are in scope for this cycle; record in your FSM platform’s goal register.
- Reflect — each technician and supervisor reviews their own work orders, completion rates, and time logs before the meeting.
- Gather inputs — pull CMMS work orders, sensor telemetry, spare-parts consumption, and ERP cost records.
- Draft assessment — the data lead produces a one-page summary of trajectory, not a line-item audit.
- Review self-appraisal — compare technician self-assessment against system data; note discrepancies without blame.
- Share agenda — circulate the draft 48 hours before the review so participants arrive prepared.
- Structured discussion — focus on trajectory and experiments, not past failures; log every decision with an owner and a date.
- Finalise documentation — update dashboards, close action items, and schedule the next checkpoint.
Pro Tip: Shift from annual reviews to integrated weekly huddles (15 minutes) and monthly performance reviews (60 minutes). Continuous, development-focused appraisals consistently outperform once-a-year retrospectives in high-uptime environments.
Which KPIs actually tell you how your assets are performing?
Choosing the right metrics is where most maintenance teams go wrong. The essential maintenance KPIs for UK asset managers fall into two categories: outcome metrics (what was achieved) and process metrics (how it was achieved). Relying solely on outcome metrics creates perverse incentives — for example, pairing MTTR with first-time fix rate prevents technicians from rushing repairs just to lower response time.
| KPI | What it measures | Calculation | Common misuse |
|---|---|---|---|
| Uptime | Asset availability | (Total time − Downtime) ÷ Total time × 100 | Ignoring planned downtime in the denominator |
| MTTR | Average repair duration | Total repair time ÷ Number of repairs | Optimising speed at the expense of fix quality |
| MTBF | Reliability between failures | Total operating time ÷ Number of failures | Using calendar time instead of operating time |
| Planned vs unplanned hours | Maintenance discipline | Planned hours ÷ Total maintenance hours × 100 | Not separating emergency callouts from reactive work |
| Backlog | Work queue health | Open work orders × Average hours per order | Treating all backlog as equally urgent |
| First-time fix rate | Repair effectiveness | First-time fixes ÷ Total repair attempts × 100 | Excluding repeat visits logged under different order numbers |
| OEE | Overall equipment effectiveness | Availability × Performance × Quality | Applying OEE to non-production assets where it distorts priorities |
In UK procurement and CAPEX justification contexts, MTBF and planned-vs-unplanned ratios carry the most weight with finance teams, because they translate directly into asset lifecycle cost projections aligned with PAS 55 and ISO 55000 expectations.
Where does reliable maintenance data actually come from?
Data quality determines whether your analysis leads to correct actions or costly mistakes. Primary sources for maintenance teams include CMMS work orders, IoT sensor telemetry, technician time logs, spare-parts inventory records, and ERP cost data. Tracking maintenance hours accurately is the foundation — without reliable time data, planned-vs-unplanned ratios and MTTR figures are meaningless.
Data quality checklist before every review:
- Completeness: every work order has a close date, asset tag, and technician ID.
- Timestamp synchronisation: sensor timestamps and CMMS records use the same time zone and clock source.
- Deduplication: repeat visits for the same fault are linked to the original work order, not logged as separate events.
- Asset tagging: assets are tagged consistently across CMMS, ERP, and inventory systems.
- Manual entry handling: flag manually entered records for spot-check validation before including them in trend analysis.
Pro Tip: Instrumentation overhead is a real risk. Capturing very high-frequency sensor data can alter system behaviour and create false bottlenecks. Use low-overhead sampling — periodic snapshots rather than continuous streaming — for production assets where data collection itself could affect performance.
| Data source | Strengths | Common issues |
|---|---|---|
| CMMS work orders | Rich fault history, labour costs | Incomplete close-out data, mis-tagged assets |
| IoT / sensor telemetry | Real-time, objective | Clock drift, sensor miscalibration |
| Technician time logs | Labour allocation detail | Observer effect from intrusive logging |
| ERP cost records | Financial accuracy | Lag between event and posting |
| Operator logs | Qualitative context | Inconsistent format, subjective language |
Practical analysis techniques that surface root-cause insight
Profile first, then trace. Aggregate trend analysis (profiling) tells you where time and cost are concentrated; event-sequence analysis (tracing) tells you why. Jumping straight to tracing without profiling wastes time investigating symptoms rather than causes.
Visualisation guide by question type:
- Time-series charts: track uptime or MTTR over rolling 13-week periods to separate trend from noise.
- Cumulative failure plots: reveal whether failures cluster around specific operating hours, flagging wear-out patterns.
- Heatmaps: show which assets or shifts generate the most unplanned work orders.
- Waterfall charts: decompose total downtime into its contributing categories (waiting for parts, diagnosis, repair, testing).
- Control charts: distinguish common-cause variation from special-cause events that warrant investigation.
For environment normalisation, simulate field constraints during analysis — for example, test asset performance under degraded power supply or peak load conditions rather than relying on controlled-environment data alone. Lab results that do not reflect field conditions lead to interventions that fail in practice.
How to run a structured performance review meeting
A well-structured review focuses on trajectory and decisions, not blame. Circulate pre-reads 48 hours in advance; the meeting itself should move through evidence, hypotheses, experiments, and owners.
Meeting agenda (60-minute monthly review):
- Pre-read confirmation (5 min) — confirm all participants have reviewed the dashboard summary.
- Evidence review (15 min) — data lead presents KPI trends; no commentary yet.
- Hypothesis testing (15 min) — team proposes explanations for significant movements.
- Experiment triage (10 min) — score proposed interventions by impact and effort; select one or two to run.
- Decisions and owners (10 min) — log each decision with a named owner and a completion date.
- Next checkpoint (5 min) — confirm date and pre-read requirements for the next review.
| Role | Responsibility | Expected output |
|---|---|---|
| Meeting owner (ops manager) | Sets agenda, keeps time, escalates blockers | Decision log, updated action register |
| Data lead | Prepares KPI dashboard, validates data quality | One-page trend summary, anomaly flags |
| Field lead (supervisor) | Provides technician context, flags data gaps | Qualitative commentary on anomalies |
| Finance rep | Reviews cost impact, supports investment cases | Cost-per-failure update, CAPEX input |
Turning analysis into prioritised actions and investment cases
Performance analysis becomes a strategic asset when it documents patterns that support investment decisions rather than serving only as a compliance exercise. A simple impact-vs-effort matrix scores each proposed intervention on two axes (1–5 each); interventions scoring above 6 combined move to experiment triage first.
Experiment template:
- Hypothesis: “Replacing the current reactive lubrication schedule with condition-based lubrication on Asset X will reduce MTTR by at least 15% within 60 days.”
- Measurement plan: compare MTTR for Asset X in the 60 days before and after the change, using CMMS work order data.
- Success criteria: MTTR reduction of 15% or more with no increase in first-time fix rate failures.
- Rollback condition: if MTTR increases or first-time fix rate drops below baseline within 30 days, revert to the previous schedule.
Pro Tip: When building an investment case for CAPEX or cloud resource changes, structure it as: problem statement, measured impact (in £ or hours), options considered, estimated ROI, and recommended next step. Finance teams in UK organisations respond to evidence-based narratives, not anecdotal reports.
Recommended cadence, resourcing, and cost in a UK context
| Review type | Frequency | Key roles | Typical time commitment |
|---|---|---|---|
| Live dashboard monitoring | Continuous | Data lead, field supervisors | 30 min/day |
| Tactical huddle | Weekly | Field lead, ops manager | 15 min |
| Performance review | Monthly | Full review team | 60 min |
| Investment review | Quarterly | Ops manager, finance rep, senior leadership | 90–120 min |
For UK organisations, quarterly investment reviews should align with internal procurement approval cycles, which generally follow regular financial periods. Asset criticality determines how tightly you compress the cadence: a facility with 99%+ uptime SLAs warrants daily dashboard checks and weekly huddles; a lower-criticality fleet may operate comfortably on fortnightly huddles and bi-monthly reviews.
Scaling guidance:
- High-criticality assets (production lines, critical infrastructure): continuous dashboards, weekly huddles, monthly reviews.
- Medium-criticality assets (HVAC, secondary equipment): weekly dashboards, monthly reviews, quarterly investment sign-off.
- Low-criticality assets: monthly dashboard review, quarterly performance discussion.
Copyable templates: KPI glossary, agenda, and data-quality checklist
KPI glossary (paste into your CMMS or SOP):
- Uptime: percentage of scheduled time an asset is available and operational.
- MTTR: mean time to repair — average hours from fault report to return to service.
- MTBF: mean time between failures — average operating hours between recorded failures.
- First-time fix rate: percentage of repairs completed correctly on the first visit.
- Planned maintenance ratio: planned hours as a percentage of total maintenance hours.
- OEE: overall equipment effectiveness — product of availability, performance rate, and quality rate.
One-page checklist for your first review cycle:
- Confirm KPIs in scope and data sources for each.
- Pull CMMS and ERP data for the review period; run the data-quality checklist.
- Produce a one-page trend summary (time-series for each KPI).
- Circulate summary and agenda 48 hours before the meeting.
- Run the 60-minute structured review; log all decisions with owners and dates.
- Update dashboards and schedule the next checkpoint before the meeting closes.
Pro Tip: Paste the agenda directly into your calendar invite so participants see it without opening an attachment. Attendance and preparation rates improve noticeably when the agenda is visible in the invite body.
Key takeaways
A continuous, 8-step performance analysis process built on balanced KPIs and validated data consistently outperforms annual reviews for UK maintenance teams managing critical assets.
| Point | Details |
|---|---|
| Use the 8-step framework | Align goals, reflect, gather data, draft, review, share agenda, discuss trajectory, finalise — repeat continuously. |
| Balance outcome and process KPIs | Pair MTTR with first-time fix rate to prevent speed optimisation at the expense of repair quality. |
| Validate data before analysis | Run the completeness, timestamp, deduplication, and tagging checks before every review cycle. |
| Match cadence to asset criticality | High-criticality assets need continuous dashboards and weekly huddles; lower-criticality assets can use monthly reviews. |
| Fullyops supports the full workflow | Fullyops maps directly to the 8-step process via work orders, real-time dashboards, time registration, and operations analytics. |
Why continuous analysis changes what maintenance teams can actually do
The conventional view treats performance analysis as a reporting obligation — something done to satisfy a quarterly audit or an annual appraisal cycle. That framing is the wrong starting point, and it produces the wrong outputs.
Teams that shift to continuous analysis stop asking “what went wrong last quarter?” and start asking “what is the trajectory, and what experiment should we run next?” The difference in decision quality is significant. When data is reviewed weekly, anomalies surface within days of occurring, while the context is still fresh and the corrective window is still open. By the time an annual review catches the same pattern, the asset may have failed twice more, and the causal chain is buried under months of subsequent events.
There is also a cultural dimension that most performance evaluation guides understate. Continuous reviews, when run with a trajectory focus rather than a blame focus, change how technicians engage with data. Self-appraisal becomes a genuine input rather than a defensive exercise, because the data is recent enough to be recognised and discussed honestly.
The resistance most teams encounter is not technical — it is the perception that weekly huddles add administrative burden. In practice, a 15-minute weekly huddle with a pre-built dashboard requires less total time per month than a single two-hour quarterly review that everyone has to prepare for from scratch.
Fullyops helps you run the 8-step process from day one
Maintenance teams that move from spreadsheets to a cloud FSM platform cut the data-gathering phase of each review from hours to minutes. Fullyops maps directly to every step in the 8-step framework: work order management captures fault history and labour time; real-time dashboards surface planned-vs-unplanned ratios and MTTR without manual exports; time registration feeds KPI calculations automatically; inventory tracking connects spare-parts consumption to downtime costs; and the operations analytics module produces the one-page trend summaries your review meetings need.
A practical first experiment: wire a Fullyops dashboard that compares planned vs unplanned hours for your three highest-criticality assets, run it for 30 days, and bring the output to your next monthly review. That single data point, reviewed consistently, is enough to build your first evidence-based investment case. For a step-by-step guide to allocating resources and planning your first intervention, the resource allocation tutorial walks through the process in detail. Book a demo to see how Fullyops fits your existing asset register and CMMS workflow.
Further reading and authoritative sources
Frameworks and methodology:
- Eight-Step Guide to Performance Evaluations, The Management Center — primary source for the 8-step workflow used throughout this article; directly applicable to maintenance team reviews.
- Employee Performance Reviews: The Complete Guide, Qualtrics — best practice on continuous vs annual appraisals and balancing outcome with process metrics.
- A Handbook for Measuring Employee Performance, OPM — structured approach to measurable, accomplishment-based performance standards; useful for KPI glossary development.
Analysis methods and tooling:
- Linux Performance Debugging with perf and bpftrace, DigitalOcean — profiling-before-scaling principle and instrumentation overhead guidance; supports the analysis methods section.
- Performance Analysis and Environment Normalisation, Chrome DevTools — environment normalisation techniques for realistic test conditions; relevant to data quality and analysis methods.
- Fullyops equipment performance analysis guide — deeper case examples for equipment-level analysis; recommended follow-up for teams ready to move beyond KPI definitions.
FAQ
What is the 8-step performance analysis process for maintenance teams?
The 8-step process covers: align goals, reflect, gather inputs, draft assessment, review self-appraisal, share agenda, run a structured trajectory-focused discussion, and finalise documentation. Applied continuously, it replaces annual reviews with a repeatable weekly and monthly cadence.
Which KPIs should maintenance teams prioritise?
Prioritise MTBF, MTTR, first-time fix rate, and planned-vs-unplanned hours as your core set. Always pair speed metrics like MTTR with quality metrics like first-time fix rate to avoid perverse incentives.
How often should a maintenance team run performance reviews?
High-criticality assets warrant continuous dashboard monitoring, weekly 15-minute huddles, and monthly 60-minute reviews. Lower-criticality assets can operate on monthly dashboards and quarterly reviews.
How does Fullyops support performance analysis?
Fullyops provides work order management, real-time dashboards, time registration, inventory tracking, and an operations analytics module that automates the data-gathering steps in the 8-step framework, reducing review preparation time significantly.
What is the biggest mistake teams make in performance analysis?
Treating performance analysis as an annual compliance exercise rather than a continuous, trajectory-focused process. Continuous feedback and development-focused reviews consistently produce better operational outcomes than retrospective annual audits.