

En resumen:
- Performance reporting is a structured process that involves collecting, analyzing, and communicating operational data to evaluate progress against targets. It supports control, accountability, and decision-making, especially in complex operations. Effective reports rely on standardized data, relevant KPIs, clear narratives, and aligned reporting frequencies to drive actionable insights.
Performance reporting is defined as the formal, systematic process of collecting, analysing, and communicating financial and operational data to evaluate progress against key targets such as KPIs, budgets, and forecasts. Operations managers and maintenance administrators rely on it to maintain control, assign accountability, and support decisions with evidence rather than instinct. The discipline draws on established frameworks including the Balanced Scorecard and the Performance Prism, both of which extend measurement beyond pure financial results. Understanding what performance reporting is, and how to apply it well, is the difference between reacting to problems and preventing them.
What is performance reporting and why does it matter?
Performance reporting integrates three core functions: control, accountability, and decision support. Control means highlighting variances between expected and actual results so that managers can intervene early. Accountability means measuring outcomes by responsibility centre, so that the right person owns each result. Decision support means translating data into actionable insights that guide resource allocation, maintenance planning, and operational adjustments.

The importance of performance reporting grows with operational complexity. A single maintenance team managing 50 assets can track performance informally. A team managing 500 assets across multiple sites cannot. At that scale, structured reporting is the only reliable way to detect patterns, allocate resources efficiently, and demonstrate compliance with maintenance procedures.
The standard industry term for this discipline is performance management reporting, though “performance reporting” is the widely used shorthand in operational contexts. Both refer to the same structured practice of converting raw data into management intelligence.
What are the key components of effective performance reporting?
Effective performance reporting rests on five interconnected components. Each one builds on the last, and a weakness in any single component undermines the entire report.
-
Accurate, standardised data collection. Convenciones de denominación normalizadas for metrics across teams are the foundation of reliable reporting. Without naming governance, automated aggregation produces inconsistent results and erodes leadership trust. Before deploying any reporting system, agree on a single label for every metric across every team.
-
Variance analysis. Variance analysis calculates the difference between expected and actual results, breaking deviations into price, quantity, and efficiency variances. Flexible budgets adapt expected outcomes to actual activity levels, isolating volume effects from efficiency effects. This separation tells you whether a cost overrun came from doing more work or from doing work less efficiently.
-
Narrative context. Numbers without explanation are incomplete. A maintenance cost that is 15% above budget means nothing without knowing whether the cause was an unplanned equipment failure, a supplier price increase, or a scheduling error. Narrative explanations provide root cause analysis and turn data into lessons.
-
KPI selection aligned to strategy. Not every measurable metric belongs in a performance report. The most effective reporting systems present decision-driving KPIs that connect directly to strategic objectives. For maintenance administrators, that typically means metrics such as mean time between failures (MTBF), planned maintenance percentage, and work order completion rate.
-
Reporting cadence matched to decision cycles. Reporting cadence should align with how frequently decisions are made: weekly for operational adjustments, monthly for integrated cross-functional review, and quarterly for strategic pivoting. Misaligned cadence leads to either missed opportunities or analysis paralysis.
Consejo profesional: Before selecting KPIs, map each one to a specific decision. If you cannot name the decision a metric informs, remove it from the report.
Which performance reporting techniques give deeper operational insight?
The two most widely adopted frameworks are the Balanced Scorecard and the Performance Prism. They differ in scope and in who they consider a stakeholder.
| Framework | Focus areas | Primary strength |
|---|---|---|
| Balanced Scorecard | Financial, customer, internal processes, learning and growth | Links operational metrics to strategic objectives across four perspectives |
| Performance Prism | Stakeholder satisfaction, strategies, processes, capabilities, contributions | Broadens accountability to include suppliers, regulators, and employees |
The Balanced Scorecard, developed by Kaplan and Norton, remains the most widely implemented framework in operational settings. It forces managers to report on non-financial dimensions, which prevents the common error of optimising short-term costs at the expense of long-term asset reliability.
En Performance Prism expands the scope further by measuring stakeholder contributions alongside stakeholder satisfaction. This matters for maintenance administrators who depend on supplier reliability and regulatory compliance, not just internal process efficiency.
The emerging direction in 2026 is toward real-time performance intelligence rather than static monthly reports. The goal is to trigger timely operational changes, not simply to display data on a dashboard. This shift requires clean, unified data feeds and clear thresholds that define when a metric demands a response.
Consejo profesional: Real-time dashboards are only useful if each metric has a defined response protocol. Without one, a flashing red indicator produces anxiety, not action.
One significant pitfall in both frameworks is dashboard fatigue. When stakeholders receive more metrics than they can act on, they stop engaging with reports altogether. The solution is not more data. It is fewer, better-chosen metrics with clear narrative context. For guidance on selecting the right operational indicators, the maintenance KPIs guide from Fullyops provides a practical starting point.
How does performance reporting improve operational efficiency?
Performance reporting applied to operations and maintenance produces measurable improvements in resource allocation, asset reliability, and response time. The connection between data and action is direct when reports are structured correctly.
-
Identifying inefficiencies before they escalate. A weekly work order completion report that shows a consistent backlog in a specific asset category signals a resourcing or scheduling problem. Without that report, the backlog grows silently until it causes unplanned downtime.
-
Aligning maintenance schedules with actual asset behaviour. Variance analysis applied to maintenance intervals reveals whether planned maintenance is occurring too early, too late, or at the right frequency. This directly reduces unnecessary labour costs and extends asset life.
-
Connecting field data to management decisions. Maintenance administrators who automate service reports reduce the time between data collection and management review. Faster reporting cycles mean faster corrective action.
-
Integrating with ERP and asset management systems. Performance reports are only as accurate as their data sources. Integration between field service management platforms and ERP systems eliminates manual data entry errors and ensures that financial and operational data match. AI-driven workflow automation further accelerates this by processing data in real time and flagging anomalies before they appear in a monthly report.
-
Distinguishing controllable from non-controllable factors. Holding managers accountable for factors outside their control, such as commodity price increases or supplier delays, demoralises teams and produces inaccurate performance assessments. Reports must explicitly separate controllable variances from external ones.
The practical result of well-structured operational reporting is that managers spend less time gathering data and more time acting on it. Reporting in facility management consistently shows efficiency gains when data collection is standardised and report cadence matches the operational decision cycle.
What are the common pitfalls in performance reporting and how do you avoid them?
The most frequent failure in performance reporting is not a technology problem. It is a design problem. Reports are built to capture data rather than to drive decisions, and the result is a document that nobody reads.
-
Inconsistent metric naming. When one team labels a metric “work orders closed” and another labels the same metric “completed jobs,” automated aggregation produces errors. Standardise naming before building any report template.
-
Over-reporting. Sending a 40-metric dashboard to a maintenance supervisor weekly produces noise, not insight. Limit operational reports to the metrics that directly inform the decisions that supervisor makes each week.
-
Ignoring narrative context. A variance figure without explanation is incomplete information. Every significant variance in a performance report should carry a one-sentence explanation of its cause and a recommended response.
-
Failing to separate controllable from non-controllable items. This is one of the most damaging errors in operational reporting. When managers are assessed on factors they cannot influence, they lose confidence in the reporting process and begin to distrust the data.
-
Misaligned reporting frequency. A quarterly report on daily operational metrics is useless for real-time decisions. A daily report on strategic KPIs creates noise. Match the cadence to the decision cycle.
Consejo profesional: Run a simple test on every report you produce: ask each recipient what decision they made because of it last month. If the answer is “none,” the report needs redesigning.
The primary value of a performance report is measured by whether it triggers necessary changes in strategy or behaviour. Reports that exist only to confirm that everything is on track are a cost, not an asset.
Principales conclusiones
Effective performance reporting requires clean data, the right KPIs, and a cadence that matches how decisions are actually made in your organisation.
| Punto | Detalles |
|---|---|
| Define reporting purpose first | Every report must link to a specific decision or it will not be used. |
| Standardise data naming | Unified metric labels across teams prevent aggregation errors and protect report credibility. |
| Use variance analysis correctly | Separate price, quantity, and efficiency variances to identify the true cause of deviations. |
| Match cadence to decision cycles | Weekly for operations, monthly for integrated review, quarterly for strategic assessment. |
| Distinguish controllable factors | Separate internal variances from external ones to maintain fair accountability and team trust. |
Why most performance reports fail before they are even read
I have reviewed operational reporting setups across industrial and field service environments, and the pattern is consistent. The report exists. The data is there. Nobody acts on it.
The problem is almost never the data itself. It is that the report was designed by someone who wanted to capture everything, rather than by someone who asked: “What decision does this number support?” A 60-row spreadsheet sent to a maintenance manager on a friday afternoon is not a performance report. It is a data dump with a header.
The shift toward real-time dashboards has made this worse in some organisations. Managers now receive live feeds of 30 metrics, none of which have defined response thresholds. The result is what practitioners call dashboard fatigue. The screen is always on, the numbers are always moving, and nothing changes because nobody knows what “bad” looks like for any given metric.
What actually works is a report built backwards from the decision. Start with the question the manager needs to answer this week. Identify the two or three metrics that answer it. Add a single sentence of narrative context for any metric that is off target. That is a performance report. Everything else is decoration.
The organisations I have seen get this right are the ones that treat reporting as a communication discipline, not a data exercise. They invest as much time in the narrative as in the numbers, and they review their report design quarterly to remove metrics that nobody has acted on.
— Pedro
How Fullyops supports performance reporting for operations teams
Fullyops is built for operations managers and maintenance administrators who need reliable data without the manual effort of assembling it. The platform centralises gestión de órdenes de trabajo and asset tracking in one place, so that performance data is always current and consistent across teams. Automated reporting features remove the gap between field activity and management visibility, giving administrators the real-time operational picture they need to act quickly. The tutorial de asignación de recursos on the Fullyops site walks through how to connect asset data to reporting workflows, making it practical for teams at any stage of their reporting maturity.
PREGUNTAS FRECUENTES
What is the performance reporting definition?
Performance reporting is the formal process of collecting, analysing, and communicating operational and financial data to evaluate progress against targets such as KPIs, budgets, and forecasts. It integrates control, accountability, and decision support into a structured management tool.
What are performance metrics in operational reporting?
Performance metrics are quantifiable measures used to evaluate progress toward specific operational objectives. Common examples for maintenance teams include mean time between failures (MTBF), work order completion rate, and planned maintenance percentage.
How do you create a performance report?
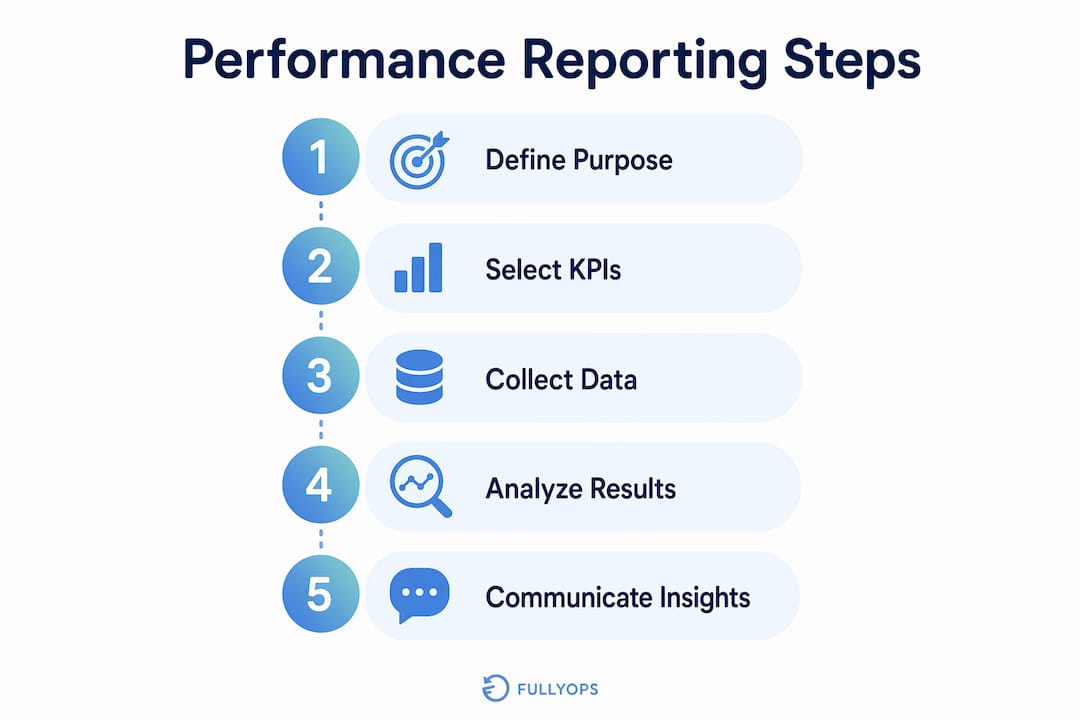
Start by defining the decision the report must support, then select KPIs aligned to that decision, unify data sources with standardised naming, structure the report with variance analysis and narrative context, and set a cadence that matches the operational decision cycle.
What is the difference between the Balanced Scorecard and the Performance Prism?
The Balanced Scorecard measures performance across four perspectives: financial, customer, internal processes, and learning. The Performance Prism broadens this by including stakeholder satisfaction, capabilities, and contributions, making it more suitable for organisations with complex supplier or regulatory relationships.
What are the best practices for performance reporting?
The most effective practices are standardising metric naming across teams, limiting reports to decision-driving KPIs, adding narrative context to every significant variance, aligning reporting cadence to decision cycles, and explicitly separating controllable from non-controllable factors.