

En bref
- Equipment downtime is a measurable problem that affects output, costs, and safety. Accurate data collection, maintenance strategies, and management routines are essential for sustained downtime reduction. Building a proactive culture and using tools like Fullyops help operations teams achieve and maintain high equipment uptime.
Equipment downtime is defined as any period when an asset is unavailable for production due to failure, maintenance, or operational disruption. For operations managers and maintenance coordinators, knowing how to reduce downtime is not a theoretical exercise. It is a measurable, manageable problem with direct consequences for output, costs, and safety. Key metrics like Mean Time Between Failures (MTBF) and Mean Time To Repair (MTTR) give you the baseline data needed to act. Without accurate measurement, every improvement effort is guesswork dressed as strategy.
How to measure and categorise downtime for effective analysis
Reliable downtime reduction starts with reliable data. You cannot fix what you cannot accurately classify. Analysis of 14,000 downtime events shows that most controllable causes fall into five categories: operational disruptions, mechanical breakdowns, electrical faults, staffing gaps, and planned maintenance activities. That finding matters because it tells you where to focus first, rather than treating every stoppage as equally urgent.
Capturing run, idle, and down status does not require complex integration. Sensors on existing machine signals, or simple operator-triggered inputs, can feed a central log without a full system overhaul. The critical step is pairing that signal data with operator-entered reason codes. Operators know why a machine stopped. Their input is the difference between a data set that says “machine down for 47 minutes” and one that says “machine down due to blocked conveyor belt on Line 3.”
The biggest pitfall in downtime data collection is inconsistent coding across shifts. Standardising reason code taxonomy across all shifts is the single most effective way to build a data set that teams actually trust and use. When codes reflect real operational experience rather than abstract categories, operators engage with the process more consistently.
- Define no more than 20–30 reason codes per asset class to avoid decision fatigue.
- Align codes to the five controllable cause categories for immediate analytical clarity.
- Review and refine codes quarterly based on what operators flag as missing or ambiguous.
- Cross-check coded data against sensor signals weekly to catch systematic miscoding early.
Conseil de pro : Involve shift supervisors in designing the reason code list before rollout. Codes they helped create are codes they will use correctly.
Which maintenance strategies effectively minimise downtime?
The most common maintenance error is staying reactive when failure history already justifies a proactive approach. Reactive maintenance, fixing equipment after it fails, is the most expensive strategy per incident and the most disruptive to production schedules. Preventive maintenance sets fixed service intervals regardless of actual asset condition. Predictive maintenance uses real-time condition data to intervene only when degradation signals warrant it.

| Approche | Déclencher | Convient le mieux à | Key limitation |
|---|---|---|---|
| Réactif | Failure occurs | Non-critical, low-cost assets | High unplanned outage risk |
| Préventive | Fixed time or usage interval | Actifs présentant des schémas d'usure prévisibles | Can cause premature replacement |
| Prédictif | Condition monitoring data | High-value, failure-critical assets | Requires sensor investment |
Using MTBF data to refine preventive maintenance intervals is a direct way to cut unnecessary service visits and catch genuine wear before it causes failure. If an asset fails consistently at 800 hours but your PM interval is 1,000 hours, you are already too late. Tighten the interval. If another asset rarely fails before 2,000 hours but you service it every 500, you are wasting labour and parts.
Condition monitoring techniques, including vibration analysis, temperature trending, and current-draw measurement, give you the signals needed to shift from calendar-based to condition-based decisions. These methods are well established in ISO 13374 and ISO 17359, which define requirements for condition monitoring data processing and diagnostics. Batching maintenance activities prevents small overlooked issues from escalating into unplanned outages. Grouping related tasks into a single planned window reduces total downtime compared to addressing each issue separately.
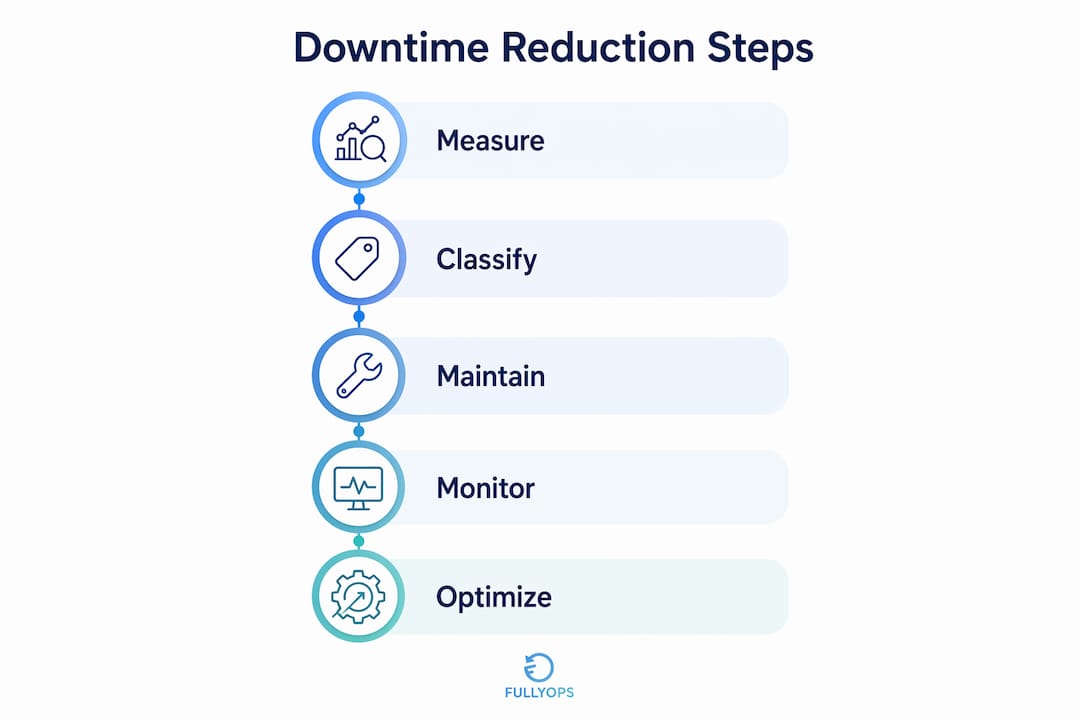
Conseil de pro : When reviewing MTBF data, separate failure modes before adjusting intervals. A bearing failure and a seal failure on the same pump may have very different optimal service frequencies.
How does AI and real-time monitoring reduce operational delays?
AI-driven monitoring changes the speed at which operations managers can respond to emerging problems. Traditional alarm systems generate dozens of alerts simultaneously during a degradation event, creating alert fatigue that slows response. AI clusters related alerts into a single prioritised signal, directing attention to the most significant degradation event rather than scattering focus across irrelevant notifications. The result is faster diagnosis and shorter MTTR.
The role of AI in maintenance scheduling is equally significant. AI-driven systems can reduce schedule revision times during disruptions by up to 70%, moving from hours of manual replanning to near-immediate automated proposals. That speed matters most when a critical asset fails mid-shift and downstream processes need rapid resequencing to avoid a cascade of delays.
Advanced scheduling models also deliver measurable efficiency gains at the asset level. Graph reinforcement learning models for scheduling reduced downstream propagation delays by 18.04% in controlled studies. That figure represents real production time recovered without adding capacity.
Key operational benefits of real-time AI monitoring include:
- Early anomaly detection before failure thresholds are reached.
- Automatic grouping of correlated alerts to prevent investigative overload.
- Dynamic schedule reoptimisation when assets go offline unexpectedly.
- Identification of recurring failure patterns across asset classes.
Flexible facility substitution built into contingency plans further reduces the ripple effect of individual asset failures. When a production line or workstation goes down, pre-defined substitution routes allow operations to continue with minimal delay. This approach, well documented in complex transport operations, applies directly to multi-line manufacturing and field service environments. For a deeper look at how AI is reshaping maintenance decisions, the role of AI in maintenance is covered in detail by industry practitioners.
Best practices for sustaining uptime gains over time
Reducing downtime once is a result. Sustaining that reduction is a system. Operations managers who achieve lasting uptime improvements build governance rhythms that keep improvement efforts alive between crises.
- Daily reviews: Check overnight downtime logs each morning. Identify any unplanned stoppages and assign a root cause owner before the shift begins.
- Weekly team reviews: Bring maintenance coordinators and production supervisors together to review the week’s top three downtime causes. Assign corrective actions with owners and deadlines.
- Monthly benchmarking: Compare MTBF and MTTR trends against the previous three months and against internal targets. Flag any asset whose failure rate is increasing.
- Quarterly process audits: Review reason code taxonomies, dashboard configurations, and cross-shift alignment. Update where operational reality has shifted.
Benchmarking against internal asset performance is more immediately useful than chasing external industry averages. Your own historical data reveals which assets are deteriorating and which maintenance interventions are working. External benchmarks from bodies such as the European Federation of National Maintenance Societies (EFNMS) provide useful context, but internal trend data drives the decisions.
Maintenance history tracking is a practical foundation for this kind of benchmarking. When failure history is complete and consistently coded, pattern recognition becomes straightforward rather than speculative.
Changeover time reduction using SMED (Single-Minute Exchange of Die) methodology is one of the most underused quick-cycle fixes available to operations managers. SMED separates internal tasks (those requiring the machine to be stopped) from external tasks (those that can be prepared in advance). Shifting tasks from internal to external directly reduces planned downtime per changeover without capital investment.
Conseil de pro : Assign a named owner to each of your top five downtime causes. Causes without owners do not get fixed. Causes with owners get reviewed, escalated, and resolved.
Principaux enseignements
Reducing equipment downtime requires accurate data, proactive maintenance, and a governance structure that sustains gains rather than celebrating one-off improvements.
| Point | Détails |
|---|---|
| Measure before you act | Classify downtime by cause using standardised reason codes before prioritising any fix. |
| Shift maintenance strategy | Use MTBF data to move from reactive to preventive or condition-based maintenance intervals. |
| Apply AI for faster response | AI alert grouping and automated schedule revision cut response times and minimise delay propagation. |
| Build governance rhythms | Daily, weekly, and monthly reviews keep improvement efforts active and accountable. |
| Sustain with standardisation | Consistent taxonomy, dashboards, and cross-shift alignment prevent data quality from degrading over time. |
Why downtime reduction is really a culture problem
I have worked with operations teams that had excellent data, well-configured dashboards, and a clear list of their top ten downtime causes. Six months later, the same causes were still at the top of the list. The technology was not the problem. The culture was.
The shift from reactive firefighting to designing for reliability is the hardest part of any downtime reduction programme. It requires operations managers to resist the pull of the urgent and invest time in the important. That means sitting in a weekly review when a breakdown is happening on the floor and trusting that the corrective action process will handle it. Most teams never make that shift fully.
What I have found actually works is keeping the metric set small. Tracking MTBF, MTTR, and planned versus unplanned maintenance ratio gives you everything you need without creating data overload. Achieving high uptime is rarely the result of a single technology. It comes from a proactive culture with consistent maintenance batching and disciplined capacity planning.
The teams that sustain uptime gains are the ones where operators feel ownership over the data they enter. When a reason code reflects something real, operators use it accurately. When it feels like a compliance exercise, they pick the nearest option and move on. That distinction, between engaged data entry and compliant data entry, is worth more than any sensor upgrade.
— Pedro
How Fullyops supports your downtime reduction efforts
Fullyops gives operations managers and maintenance coordinators the tools to put these strategies into practice without building a custom system from scratch. The platform covers gestion des ordres de travail with real-time dashboards, maintenance scheduling, asset tracking, and operational analytics in a single environment. Teams can log downtime events, assign reason codes, and track corrective actions across shifts without switching between systems. The tutoriel sur l'allocation des ressources walks through how to align technician availability with asset criticality, a practical starting point for any team moving from reactive to planned maintenance. Fullyops also integrates with existing ERP and field service systems, so your data stays connected across the operation.
FAQ
What is the difference between MTBF and MTTR?
MTBF (Mean Time Between Failures) measures the average time an asset operates before failing. MTTR (Mean Time To Repair) measures the average time taken to restore it after a failure.
How do I start reducing downtime if I have no existing data?
Begin by capturing run, idle, and down status using existing machine signals or simple operator inputs, then add reason codes aligned to the five main cause categories: operational, mechanical, electrical, staffing, and maintenance.
When does predictive maintenance make financial sense?
Predictive maintenance is justified for high-value or failure-critical assets where the cost of unplanned failure significantly exceeds the cost of condition monitoring sensors and analysis.
How does AI reduce downtime in practice?
AI groups correlated alerts into a single prioritised signal, cutting investigation time, and can revise production schedules automatically when an asset fails, reducing downstream delay propagation.
What is SMED and how does it reduce planned downtime?
SMED (Single-Minute Exchange of Die) is a methodology that separates changeover tasks into those requiring a machine stop and those that can be prepared in advance, reducing total planned downtime per changeover.
Recommandé
- Why monitor machine downtime: a manager’s guide
- What is equipment downtime? A guide for operations managers
- Processus de gestion des ordres de travail pour réduire les temps d'arrêt
- What is downtime analysis? A guide for maintenance managers