

En bref
- Downtime analysis systematically records and classifies machine stoppages to reduce operational losses. It uses metrics like OEE, MTBF, and MTTR to identify root causes and improve maintenance efficiency. Proper classification and automated data capture lead to significant reductions in unplanned downtime and operational costs.
Downtime analysis is the systematic study of machine and equipment stoppages during scheduled production time to identify root causes and improve operational efficiency. The recognised industry term for this practice is production loss analysis, though downtime analysis is the phrase most maintenance managers use day to day. Standards such as ISO 22400 and the TPM Six Big Losses framework provide the classification structures that make this analysis meaningful. The stakes are high: unplanned downtime costs the average small-to-mid-size manufacturer £5,600 per hour, yet 62% of those facilities cannot accurately quantify total downtime or identify their top root causes. That gap between cost and visibility is precisely what structured downtime analysis closes.
What is downtime analysis and why does it matter?
Downtime analysis is defined as the structured process of recording, classifying, and investigating equipment stoppages to reduce their frequency, duration, and operational impact. It sits at the heart of any credible maintenance improvement programme. Without it, maintenance managers are reacting to failures rather than preventing them.
The analysis draws on three core metrics: Overall Equipment Effectiveness (OEE), Mean Time Between Failures (MTBF), and Mean Time To Repair (MTTR). OEE combines availability, performance, and quality into a single percentage that reflects true productive output. MTBF and MTTR tell you how often equipment fails and how long recovery takes. Together, these metrics give maintenance teams a quantified baseline from which to measure progress.
Manufacturers lose 5%–20% of productive capacity to unplanned downtime. That figure alone justifies the investment in a disciplined analysis process. The importance of downtime analysis extends beyond cost reduction: it also supports regulatory compliance, asset lifecycle planning, and maintenance team accountability.
What are the main categories of downtime to analyse?
Classifying downtime correctly is the foundation of any useful analysis. The wrong category leads to the wrong corrective action. The Six Big Losses framework, developed within Total Productive Maintenance (TPM), provides the most widely used classification structure.
Les Six Big Losses framework categorises production losses into six distinct types, each linked to specific improvement countermeasures:
- Equipment failure — unplanned breakdowns that stop production entirely, typically the highest-cost loss category.
- Setup and changeover — time lost during planned transitions between products or production runs.
- Idling and minor stops — brief interruptions under a few minutes where the machine stops but does not break down.
- Reduced speed — the machine runs but below its designed rate, often masked in manual records.
- Startup losses — quality or output losses during the warm-up phase after a planned stop.
- Defects and rework — time consumed producing non-conforming output that must be scrapped or corrected.
Beyond the Six Big Losses, maintenance managers must also distinguish between downtime et idle time. Differentiating idle time from downtime is critical for accurate measurement of operational availability. Idle time refers to periods when production was never scheduled. Counting idle time as downtime inflates perceived losses and misguides improvement efforts entirely.
Conseil de pro : Assign each downtime event to a single category at the point of recording, not retrospectively. Retrospective categorisation introduces interpretation bias and reduces the reliability of trend data.
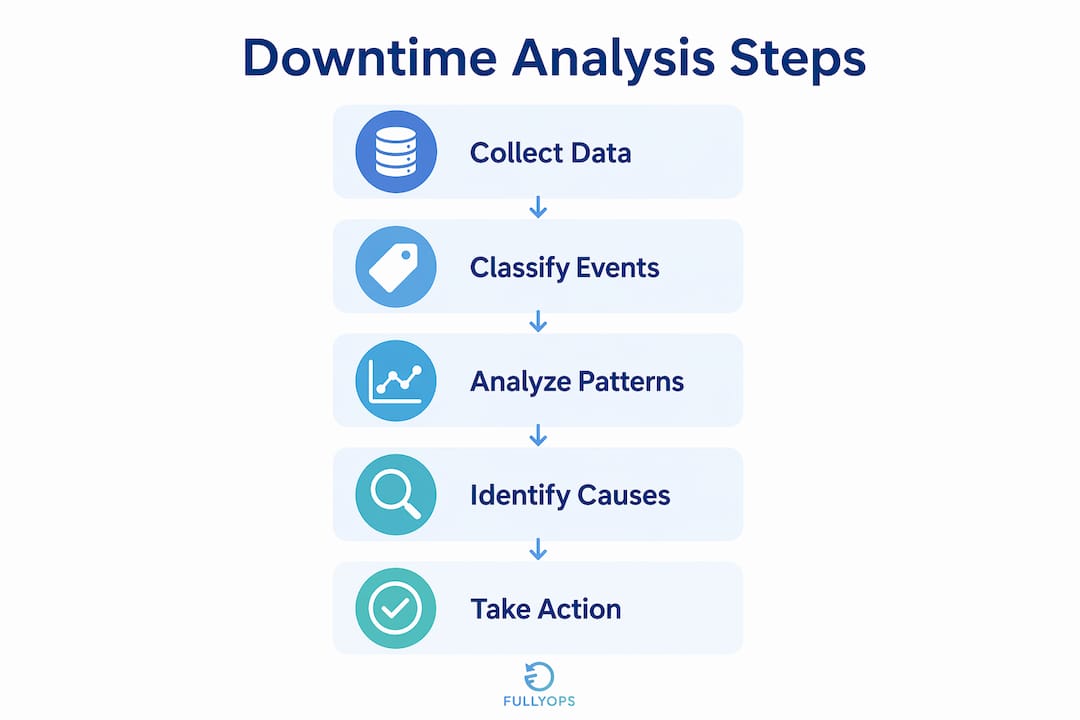
How is downtime analysis conducted effectively?
Effective downtime analysis follows a repeatable process. Skipping steps, particularly data classification, produces unreliable outputs that waste maintenance resources.
-
Establish a data collection method. Automated logging via machine sensors or SCADA systems captures events in real time and eliminates manual gaps. Manual recording remains common but misses a significant proportion of losses. 30%–50% of losses are micro-stops under two minutes, which manual logging cannot detect. Automation is not optional for teams that want an accurate picture.
-
Apply a structured taxonomy. Assign standard codes to each downtime category before data collection begins. Consistent codes allow comparison across shifts, lines, and sites. Without them, one operator’s “mechanical fault” is another’s “electrical fault,” and the data becomes unanalysable.
-
Run a Pareto analysis. Once data is collected, rank downtime causes by total time lost. 20% of downtime causes typically drive 80% of losses. Pareto analysis directs attention to the vital few causes rather than spreading effort across all events equally.
-
Calculate and track KPIs. OEE, MTBF, and MTTR should be calculated at a consistent frequency, weekly at minimum. These KPIs translate raw downtime data into performance trends that management can act on.
-
Review and act on findings. Data without action is administrative overhead. Schedule a fixed weekly review where downtime trends are presented alongside proposed corrective actions. Assign ownership and deadlines.
A common pitfall is demanding too much from operators at the point of data entry. Limiting operator input to the top three downtime causes per month, with linked corrective actions, maintains high data integrity without creating compliance fatigue.
Conseil de pro : Start with five downtime codes, not fifty. A simple taxonomy that operators use consistently produces better insights than a detailed taxonomy that gets ignored.
What benefits can organisations expect from downtime analysis?
The measurable returns from systematic downtime analysis are well established. Facilities that implement structured tracking see a 15%–25% reduction in unplanned downtime in the first year, with a further 10%–15% reduction in year two. That trajectory reflects the compounding effect of better data leading to better decisions.
The financial case is equally clear. At £5,600 per hour of unplanned downtime, a 20% reduction in stoppages on a line running 250 days per year represents a material saving. Capacity recovery is the other major gain: every hour of downtime eliminated is an hour of production restored without capital expenditure.
Operator engagement is a less obvious but equally important benefit. Operator data entry compliance exceeds 90% when downtime data is visibly connected to improvement actions. When operators see their reports lead to a fix, they record the next event accurately. When data disappears into a spreadsheet and nothing changes, compliance drops to 54%. The data-to-action cycle is not just good management practice. It is the mechanism that keeps the analysis process alive.
Additional benefits include:
- Reduced maintenance costs through targeted, evidence-based interventions rather than blanket preventive schedules.
- Improved OEE scores, which directly affect production capacity and customer delivery performance.
- Stronger asset lifecycle planning, as failure patterns reveal which equipment is approaching end of useful life.
- Compliance with maintenance standards and audit requirements, supported by documented analysis records.
Reviewing outils de suivi de maintenance that automate data capture and reporting accelerates the realisation of these benefits considerably.
How does downtime analysis connect to root cause investigation?
Downtime analysis identifies what is failing and how often. Root cause analysis (RCA) answers why it is failing. The two practices are complementary, not interchangeable.
RCA is triggered by downtime analysis findings. When a Pareto chart shows that a single failure mode accounts for 40% of lost production time, that is the signal to open a formal root cause investigation. Applying RCA to every downtime event is neither practical nor necessary.
Techniques such as 5 Whys and fishbone diagrams help verify and address underlying failure reasons rather than symptoms, preventing recurring downtime. The 5 Whys method works by asking “why” repeatedly until the physical, human, or systemic root cause is reached. Fishbone diagrams (also called Ishikawa diagrams) map potential causes across categories such as machine, method, material, and environment. Fault tree analysis is a more formal technique suited to safety-critical failures.
Apply RCA when a failure meets one or more of these criteria:
- High total time lost over a rolling 30-day period.
- Recurring failures on the same asset or component.
- Safety implications for personnel or equipment.
- High repair cost relative to asset value.
Consistent reporting of downtime alongside verification of corrective actions leads to reduced failure recurrence and improved maintenance team effectiveness. The verification step is where most teams fall short. A corrective action is only complete when a follow-up data review confirms the failure has not recurred. Without that confirmation, the improvement cycle is open-ended and the same failure returns.
Integrating downtime analysis with continuous improvement cycles, daily shift reviews, weekly trend meetings, and monthly management reports, creates the cadence that sustains operational gains over time. The processus de gestion des ordres de travail is the operational mechanism that translates RCA findings into scheduled maintenance tasks with assigned ownership.
Principaux enseignements
Downtime analysis is the structured process of classifying and investigating equipment stoppages, and facilities that apply it systematically reduce unplanned downtime by 15%–25% in the first year.
| Point | Détails |
|---|---|
| Define before you measure | Distinguish downtime from idle time to avoid inflating loss figures and misdirecting improvement effort. |
| Use the Six Big Losses | Classify every stoppage into one of six TPM categories to link each loss to a specific corrective action. |
| Automate data capture | Manual logging misses 30%–50% of losses; automated systems capture micro-stops that manual records cannot. |
| Apply Pareto before RCA | Rank causes by total time lost first, then apply root cause analysis only to the top contributors. |
| Close the action loop | Verify corrective actions with follow-up data; open loops allow the same failures to recur. |
Why most downtime programmes stall before they deliver
The most common failure I see in downtime analysis programmes is not a technology problem. It is a categorisation problem. Teams invest in data collection systems, generate impressive dashboards, and then discover that the underlying data is inconsistent because nobody agreed on what “mechanical failure” means across three shifts. The analysis produces noise, not insight, and leadership loses confidence in the process.
My strong view is that data classification discipline must be established before any analytics or predictive maintenance model is introduced. Implementing predictive maintenance prematurely, before clean data hierarchies exist, wastes capital and produces models that cannot be trusted. Start with five clear codes, train every operator on them, and enforce them for 90 days before adding complexity.
The second pitfall is failing to show operators that their data matters. Compliance does not come from mandates. It comes from operators watching a recurring fault get fixed because they logged it accurately. That feedback loop is the most powerful tool a maintenance manager has. Build it deliberately, and the data quality problem largely solves itself.
— Pedro
How Fullyops supports downtime analysis in practice
Fullyops gives maintenance managers the tools to move from data collection to corrective action without switching between systems. The platform captures downtime events, classifies them against a configurable taxonomy, and surfaces Pareto-ranked reports that show exactly where production losses are concentrated. Work orders are generated directly from downtime findings, with resource allocation and technician assignment handled in the same workflow.
For teams building a work order management process that closes the loop between analysis and action, Fullyops connects the operational data to the maintenance response in real time. The result is a shorter gap between identifying a failure pattern and deploying a fix, which is where the measurable reductions in unplanned downtime are won.
FAQ
What is the difference between downtime and idle time?
Downtime refers to stoppages during scheduled production time. Idle time is when production was never planned. Conflating the two inflates loss figures and leads to incorrect improvement priorities.
How do you conduct downtime analysis step by step?
Collect event data using automated logging where possible, classify each event with a standard code, apply Pareto analysis to rank causes by total time lost, calculate OEE and MTTR, then assign corrective actions with verified follow-up.
What causes the most downtime in manufacturing?
Equipment failure and minor stops together account for the majority of production losses in most facilities. 20% of causes typically drive 80% of total downtime, making Pareto-based prioritisation the most efficient starting point.
What tools are used for downtime analysis?
Maintenance teams use a combination of automated data loggers, CMMS platforms, and operational analytics software. The most effective tools integrate data capture, classification, and work order generation in a single system, as Fullyops does.
How quickly can downtime analysis deliver results?
Facilities with structured tracking programmes see a 15%–25% reduction in unplanned downtime within the first year. The speed of improvement depends on data quality, categorisation consistency, and how quickly corrective actions are verified and closed.
Recommandé
- Why monitor machine downtime: a manager’s guide
- What is equipment downtime? A guide for operations managers
- Maintenance scheduling guide to optimise asset uptime
- Planification de la maintenance étape par étape : Réduire les temps d'arrêt par 30%