TL;DR:
- Implementing a structured preventive maintenance program can reduce breakdowns by up to 60%, lowering costs and extending asset life. Essential prerequisites include accurate asset data, trained personnel, OEM documentation, and reliable communication tools, all supporting effective scheduling and execution. Continuous improvement relies on tracking key metrics, leveraging data analysis, and utilizing digital tools for automation and strategic decision-making.
Unplanned breakdowns cost industrial operations far more than the immediate repair bill. Lost production time, emergency call-out rates, expedited parts procurement, and reputational damage compound quickly into figures that erode quarterly profit. Yet many maintenance teams still operate reactively, responding to failures rather than preventing them. A structured preventive maintenance (PM) programme changes that equation entirely. PM reduces breakdowns by 40 to 60%, cuts maintenance costs by 25 to 35%, and extends asset life by 20 to 40%. This article gives you a clear, adaptable framework to implement or sharpen your PM approach and deliver those results.
Table of Contents
- What you need before you start
- Step-by-step framework for preventive maintenance
- Avoiding common pitfalls and optimising your PM
- How to measure and continuously improve preventive maintenance
- Why most PM programmes fall short—and how to achieve real results
- Build stronger maintenance programmes with digital support
- Frequently asked questions
Key Takeaways
| Point | Details |
|---|---|
| Component-based approach | Organise checklists by system or component for full coverage and clarity. |
| Focus on critical assets | Allocate most resources to the top 15% assets that impact uptime the most. |
| Review and refine regularly | Continually analyse metrics and feedback to improve preventive maintenance. |
| Avoid over-maintenance | Balance task frequency with real risk to yield better reliability and ROI. |
What you need before you start
Having set the stage for why preventive maintenance matters, it is time to clarify what is needed to get started. Rushing into scheduling without the right foundations produces checklists nobody uses and intervals nobody trusts. Getting the prerequisites right takes discipline, but it saves considerable effort later.
Asset data and maintenance records are the starting point. You need an accurate inventory of every asset, including make, model, age, location, and criticality rating. Historical maintenance records, even incomplete ones, reveal failure patterns and inform realistic scheduling. Without this baseline, you are guessing rather than planning.
Team roles and required skills must be clearly defined before any schedule goes live. Assign a PM coordinator responsible for schedule adherence, and identify which technicians hold the qualifications for specific equipment types. Skills gaps should be logged and addressed through training before those assets enter the PM cycle.
OEM manuals and safety guidelines are non-negotiable. Manufacturer recommendations provide the technical foundation for task content and intervals. Safety datasheets and regulatory requirements must be incorporated from the outset, not added as an afterthought.
Documentation and communication tools tie everything together. Whether you use a computerised maintenance management system (CMMS) or structured spreadsheets, the format must be accessible, consistent, and auditable. Organise PM checklists by system and component, not just by frequency. This approach makes it far easier for technicians to work systematically through related components in a single visit, reducing revisit costs and improving thoroughness.
| Prerequisite | Why it matters | Common gap |
|---|---|---|
| Asset inventory | Defines scope and criticality | Missing or outdated records |
| Maintenance history | Reveals failure patterns | Paper records not digitised |
| OEM documentation | Sets task content and intervals | Manuals not filed or accessible |
| Team skills map | Ensures task competency | No formal skills register |
| Communication tools | Supports schedule adherence | Inconsistent formats |
Good maintenance schedule creation begins here, at the data layer. Before a single task is scheduled, your team should be able to answer: what do we maintain, who maintains it, and how do we know it is done correctly?
Pro Tip: Conduct a one-day data audit before launching your PM programme. Pull your asset register, cross-reference it against physical assets on the floor, and flag any missing OEM documentation. This single exercise regularly uncovers 15 to 20% of unregistered or incorrectly categorised assets that would otherwise fall outside the PM scope.
Understanding asset lifecycle management tips at this stage also helps you prioritise which assets require immediate PM attention versus those that may be approaching end of life and are better candidates for replacement planning.
Step-by-step framework for preventive maintenance
With tools and requirements in hand, you can now structure an effective step-by-step process. A repeatable framework removes ambiguity, keeps teams aligned, and creates the data trail needed for continuous improvement.
-
Conduct an asset criticality assessment. Rank every asset by its impact on production, safety, regulatory compliance, and replacement cost. Assets that would halt production entirely if they failed belong in the highest criticality tier and receive the most frequent and thorough PM attention. Less critical assets can be maintained less intensively or run to failure, depending on failure consequences.
-
Develop system and component-based checklists. Group tasks by mechanical system, electrical system, lubrication points, and structural components rather than simply listing everything by calendar month. This mirrors how technicians actually work and reduces the chance of missed items. Each checklist should specify the task, the acceptance criteria, the tool required, and the estimated duration.
-
Allocate resources and build the schedule. Match task frequency to asset criticality and OEM guidance. Assign tasks to qualified technicians with realistic time allowances. Stagger PM workloads across shifts and weeks to avoid bottlenecks. Identify any specialist tools or parts that require advance procurement and build lead times into the schedule.
-
Execute and track compliance in real time. Technicians should sign off on each task as it is completed, noting any observations or anomalies. Compliance tracking at this level creates the evidence base for performance review and supports regulatory audits. PM workflow strategies that link execution data directly to asset records significantly reduce reporting lag.
-
Review and adjust using failure and performance data. After each review period, analyse which assets experienced failures despite PM, which tasks are consistently marked as unnecessary, and where labour hours are being consumed disproportionately. Weibull analysis optimises intervals and reduces over-maintenance by 30 to 45%, making it one of the most powerful tools available for refining interval selection.
| PM maturity level | PM ratio | Compliance rate | Maintenance cost as % of RAV |
|---|---|---|---|
| Reactive | Below 40% | Below 50% | Above 8% |
| Developing | 40 to 60% | 50 to 75% | 5 to 8% |
| Proactive | 60 to 75% | 75 to 90% | 3 to 5% |
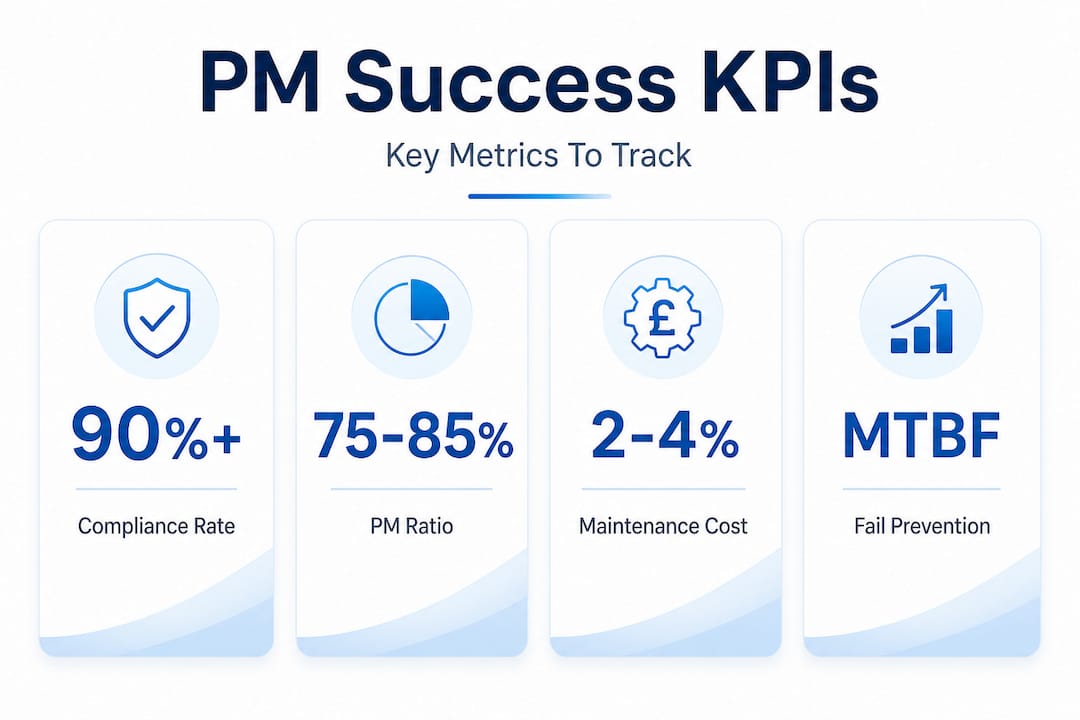
| World class | 75 to 85% | Above 90% | 2 to 4% |
World-class PM programmes achieve a PM ratio of 75 to 85%, compliance rates above 90%, and maintenance costs of just 2 to 4% of replacement asset value (RAV). These benchmarks give operations managers clear targets to aim for at each stage of maturity.
Pro Tip: Do not build your entire schedule in one go. Start with your top 20% of critical assets, refine the process, and then expand. Teams that try to implement PM for every asset simultaneously often burn out within three months and revert to reactive habits.
Reviewing preventive maintenance essentials and PM examples from comparable industrial environments can also help validate your checklist content and interval choices before you commit to a full rollout.
Avoiding common pitfalls and optimising your PM
Even with a clear process, it is easy to slip into unproductive habits. The most damaging mistakes in PM programmes are not always obvious, and many teams do not realise they are making them until the budget or reliability data reveals the problem.

Over-maintenance is more widespread than most teams admit. 41% of PM programmes fail to deliver a return on investment because they over-maintain assets, spending labour and parts on equipment that does not require intervention at those frequencies. The assumption that more maintenance equals more reliability is simply not supported by failure data.
Failing to distinguish between random and age-related failures leads to misaligned strategies. Some failures follow a predictable age-related pattern, making time-based PM appropriate. Others are essentially random and cannot be prevented by scheduled intervention. For random failures, condition-based maintenance (CBM) or a run-to-failure strategy is more cost-effective than fixed-interval PM. Identifying which failure mode applies to each asset type is a critical step that many programmes skip.
Key pitfalls to avoid:
- Applying identical intervals to all assets regardless of criticality or usage
- Using PM checklists that have not been updated since initial commissioning
- Allowing compliance data to be self-reported without verification
- Ignoring technician feedback on task relevance and actual task duration
- Failing to track parts consumption by asset, which obscures true cost per asset
Condition-based maintenance uses dynamic thresholds, such as vibration amplitude, temperature trends, and oil contamination levels, to trigger intervention only when asset condition warrants it. This approach reduces unnecessary maintenance activity and preserves component life by avoiding the “infant mortality” failures that can occur immediately after any maintenance intervention.
Budget allocation is another area where poor decisions consistently reduce PM ROI. Concentrating resources on assets with the highest criticality rather than spreading budgets evenly is a proven strategy. Review real-life examples of how industrial teams have restructured their PM spend to focus on the assets where failure consequences are highest.
Pro Tip: Build a simple failure mode library for your top 30 critical assets. For each asset, document whether primary failure modes are age-related or random. Use this to decide whether time-based PM, CBM, or run-to-failure is the appropriate strategy. You will likely find that 20 to 30% of your current PM tasks can be eliminated or replaced with lower-cost monitoring.
How to measure and continuously improve preventive maintenance
Establishing a preventive routine is only the start. True gains come from ongoing refinement and measurement. Without structured performance tracking, PM programmes drift, compliance becomes a formality, and reliability improvements stall.
Key metrics to track consistently:
- Prevented failures: The number of failures avoided through PM activity, measured against historical failure rates before the programme was implemented
- Mean time between failure (MTBF): Tracks how long assets operate between failures; rising MTBF indicates that PM is working
- PM compliance rate: The percentage of scheduled tasks completed on time; a strong indicator of programme discipline
- Cost per asset: Total maintenance spend divided by asset count, tracked over time to reveal whether costs are declining as PM matures
- Downtime reduction: Total unplanned downtime compared to the baseline period before PM implementation
Measure PM effectiveness via prevented failures and MTBF, not just compliance. A team that completes 100% of scheduled tasks but never reduces failures has a compliance problem disguised as a success story. Real effectiveness is measured in outcomes, not outputs.
| Metric | Baseline target | World-class target | Review frequency |
|---|---|---|---|
| PM compliance rate | 70% | Above 90% | Monthly |
| MTBF (critical assets) | Establish baseline | 20% improvement per year | Quarterly |
| Unplanned downtime | Establish baseline | 45 to 50% reduction | Monthly |
| Maintenance cost as % of RAV | Below 8% | 2 to 4% | Quarterly |
| Prevented failures | Track from launch | Increasing trend | Quarterly |
Continuous review prevents stagnation. Schedule formal PM review meetings quarterly, involving both maintenance technicians and operations managers. Technicians provide ground-level insight on task relevance, while operations managers connect maintenance performance to production outcomes. This dual perspective prevents the disconnect that develops when PM is managed in isolation from operational priorities.
Learning from unexpected failures is equally important. When an asset fails despite being on a PM schedule, treat it as a diagnostic opportunity. Root cause analysis should identify whether the failure mode was predictable, whether the PM task addressed the correct failure mechanism, and whether the interval was appropriate. These findings feed directly back into checklist and interval revisions, making the programme progressively more accurate.
Reviewing maintenance process examples from sectors with similar asset profiles can provide useful benchmarking data when setting initial improvement targets.
Why most PM programmes fall short—and how to achieve real results
The uncomfortable truth is that most PM programmes are built around compliance, not prevention. Teams track whether tasks were completed, report the numbers upward, and consider the job done. The failure rates and cost data tell a different story.
Effective PM is not a documentation exercise. It is a feedback system. Every completed task, every observed anomaly, and every failure event should generate data that informs the next scheduling cycle. When programmes lose this feedback loop, they become rituals rather than tools. Technicians complete tasks because they are on the list, not because there is evidence the tasks prevent the failures that actually occur.
The focus question every operations manager should ask regularly is this: are we preventing the failures that matter, or are we maintaining the assets that are easiest to schedule? Focusing 50% of the maintenance budget on the top 15% of assets consistently delivers better ROI than spreading resource evenly across the entire estate. Selective investment, guided by criticality and failure consequence, outperforms volume-based approaches every time.
Leadership accountability is the other frequently missing ingredient. PM programmes require senior sponsorship not just at launch, but on an ongoing basis. When review meetings are cancelled, when KPI targets are not challenged, and when honest failure data is suppressed to protect performance scores, PM quality degrades rapidly. The organisations that sustain world-class maintenance programmes treat reliability data as a strategic asset and invest in maintenance management platforms that make that data visible and actionable across the team.
Build stronger maintenance programmes with digital support
Implementing the framework described in this article manually is possible, but digital tools remove the friction that causes programmes to slip. Automated scheduling, real-time compliance tracking, and integrated asset records eliminate the administrative burden that erodes maintenance quality over time.
FullyOps provides a SaaS platform designed specifically for industrial maintenance teams, with tools for work order management, intervention tracking, operational analytics, and inventory management. Understanding the landscape of asset management systems helps teams select the right level of technology for their current maturity. For teams ready to evaluate their options, reviewing top maintenance management software shortlists the platforms best suited to industrial PM environments. Technology does not replace the strategic thinking this article outlines; it amplifies it.
Frequently asked questions
What is the difference between preventive and predictive maintenance?
Preventive maintenance follows scheduled tasks based on time or usage intervals, while predictive maintenance uses real-time condition monitoring to anticipate failures before they occur. For random failures, PM is largely ineffective and predictive or run-to-failure strategies are more appropriate.
How do I decide which assets need the most attention in my PM plan?
Rank assets by criticality, considering production impact, safety risk, and replacement cost. Focus 50% of your budget on the top 15% of critical assets to maximise return on investment.
What KPIs should I track to measure preventive maintenance success?
Track prevented failures, MTBF, compliance rate, cost per asset, and downtime reduction. PM effectiveness via MTBF provides a more accurate picture of programme success than compliance rates alone.
How often should preventive maintenance checklists be reviewed or updated?
Review PM checklists at least annually and after any major asset change, modification, or unexpected failure event. Continuous review prevents stagnation and keeps task content aligned with actual failure modes.
What is the biggest mistake industrial teams make with PM?
Over-maintenance is the most common and costly mistake, consuming labour and parts budgets without improving reliability. 41% of PM programmes fail to deliver a return on investment for precisely this reason.
Recommended
- Essential preventive maintenance steps: maximise reliability
- Essential preventive maintenance tips for reliable operations
- Essential HVAC Preventative Maintenance Guide for Homeowners