Resumo:
- Operational efficiency is often misunderstood as a single number, but it reflects a complex, multi-dimensional system that requires detailed diagnosis. Proper measurement involves decomposing metrics like OEE into specific loss categories—availability, performance, and quality—to identify targeted improvement actions. Leaders who treat efficiency metrics as diagnostic tools rather than performance targets achieve more meaningful and sustainable operational improvements.
Operational efficiency is one of the most frequently cited goals in industrial operations, yet it remains one of the most misunderstood. Many facility leaders treat it as a single number to maximise, a percentage to report upward, or a KPI to tick off a quarterly dashboard. That assumption leads to misdiagnosis, wasted capital expenditure, and maintenance programmes that address symptoms rather than root causes. This guide cuts through the noise by offering precise definitions, evidence-based measurement frameworks, and practical steps to translate efficiency data into meaningful action across your assets and teams.
Índice
- Understanding operational efficiency: definition and fundamentals
- The OEE framework: how to measure and break down efficiency
- Beyond OEE: modern metrics and when to expand your view
- Applying efficiency metrics in practice: diagnosis to action
- A perspective from the field: what most leaders miss about efficiency metrics
- Enhancing your operational efficiency: tools and next steps
- Perguntas mais frequentes
Principais conclusões
| Ponto | Detalhes |
|---|---|
| Breakdown is key | Don’t treat operational efficiency as a single score—decompose it to pinpoint root problems. |
| Measure what matters | Classic OEE is a starting point, but adapt your metrics to real-time, local needs for greater insight. |
| From diagnosis to action | Leverage decomposed metrics to assign targeted improvements, not just track performance. |
| Evolve with context | Revisit and clearly define your metrics as your operational landscape changes. |
Understanding operational efficiency: definition and fundamentals
Operational efficiency, in plain terms, refers to the ability of a facility or process to deliver maximum output from its available resources while minimising waste, downtime, and defects. In industrial contexts, this definition extends well beyond cost-per-unit calculations. It encompasses equipment reliability, process consistency, workforce productivity, and quality output, all working together as interdependent variables.
The problem is that most organisations reduce this to a single headline figure, and that is where the trouble starts. A composite score of 78% tells you very little on its own. It does not tell you whether your losses are driven by unplanned stoppages, slow cycle speeds, or rejected product. Without that level of detail, improvement initiatives are essentially guesswork.
Consider what operational efficiency is and what it is not:
What operational efficiency is:
- A multi-dimensional measure of how well resources are being converted into productive output
- A diagnostic framework for identifying specific categories of loss
- A continuous improvement target tied to specific, measurable root causes
- A tool for aligning maintenance, production, and quality functions around shared data
What operational efficiency is not:
- A single number that captures the full health of your operations
- A static benchmark to be reported once per quarter
- Synonymous with cost-cutting or headcount reduction
- Something that can be improved without first understanding where losses occur
“Expert practice emphasises decomposing the composite score to diagnose the specific loss category, rather than treating OEE as a monolithic number to be maximised in isolation.”
This distinction matters enormously. Facility leaders who pursue a headline figure without decomposing it will often invest in the wrong areas. For example, spending on faster machinery when the real constraint is poor availability due to unplanned maintenance. Improving operational efficiency for field services follows the same logic: you need to understand exactly where time and resource are being lost before you can meaningfully intervene.
The OEE framework: how to measure and break down efficiency
OEE, or Overall Equipment Effectiveness, is the most widely used metric for quantifying operational efficiency in manufacturing and industrial environments. It is calculated as:
OEE = Availability × Performance × Quality
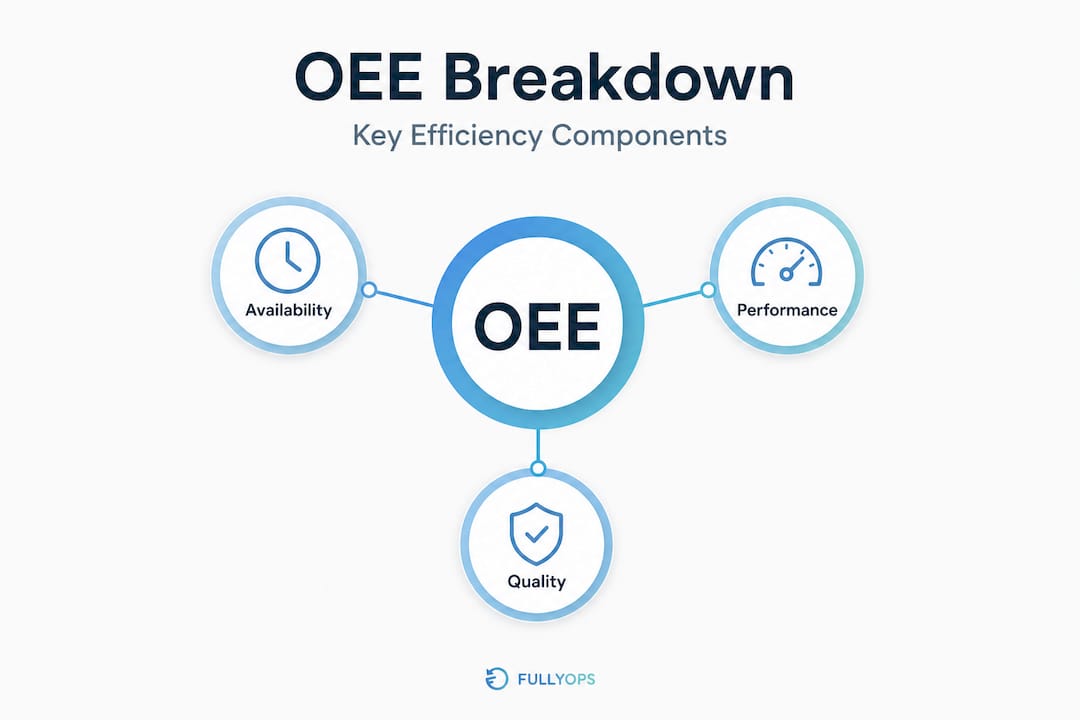
Each component captures a distinct category of loss, and understanding all three is essential to any credible efficiency programme.
| OEE component | What it measures | Typical causes of loss |
|---|---|---|
| Availability | Percentage of scheduled time the equipment is actually running | Unplanned breakdowns, changeover delays, waiting for materials |
| Performance | Speed of production relative to ideal or theoretical maximum | Reduced speed running, minor stoppages, operator inefficiency |
| Quality | Proportion of output that meets specification on first pass | Defects, rework, scrap, startup waste |
A world-class OEE score is generally considered to be 85% or above, though this benchmark must be interpreted carefully. OEE is calculated from these three components, and a facility may score well overall while still experiencing significant losses in one category that the aggregate figure conceals.
Here is a straightforward process for collecting data and computing OEE for a single machine or production line:
- Define the planned production time. Start with the total available shift time and subtract any planned stoppages such as scheduled breaks or planned maintenance windows. This gives you the planned production time.
- Record actual run time. Log all unplanned stoppages, breakdowns, and delays during the shift. Subtract these from planned production time to calculate actual run time. Availability equals actual run time divided by planned production time.
- Measure actual output versus ideal output. Determine the ideal cycle time for the machine and multiply it by actual run time to calculate the theoretical maximum output. Divide actual output by this figure to get your Performance score.
- Track good versus total output. Count only units that pass quality checks on the first attempt. Divide this by total units produced to calculate Quality.
- Multiply the three scores together. Availability × Performance × Quality gives you the OEE percentage for that machine, shift, or product run.
- Record results consistently. Use the same methodology for every shift and every asset so that comparisons are valid over time.
Pro Tip: Track OEE separately by machine, shift, and product line rather than rolling everything into a single plant-wide figure. A blended score across ten machines will mask the one asset dragging your availability down to 60%, while the other nine run at 90%.
Improving field service efficiency relies on an equally granular approach: segment performance data by technician, asset type, and service region to identify where the real losses are concentrated rather than acting on aggregate trends.

Beyond OEE: modern metrics and when to expand your view
While OEE remains the foundation of industrial efficiency measurement, it was originally designed for discrete manufacturing environments. As operations have grown more complex, involving multi-product lines, variable demand, and interconnected asset systems, a growing body of research and practice has evolved to address its limitations.
Expanded OEE frameworks, including Modified Overall Equipment Effectiveness (MOEE), incorporate additional operational factors that classic OEE does not capture. MOEE, for instance, may account for factors such as planned maintenance losses, energy efficiency, or demand-driven utilisation rates. This makes it more relevant for facilities operating in highly variable production environments.
| Métrica | What it measures | Mais adequado para | Key trade-off |
|---|---|---|---|
| Classic OEE | Availability × Performance × Quality | Stable, single-product manufacturing lines | Simple and consistent, but may miss context-specific losses |
| MOEE (Modified OEE) | OEE plus additional operational factors | Multi-product, variable demand environments | More relevant, but harder to benchmark across sites |
| Holistic KPIs | Asset reliability, energy use, lifecycle cost, SLA compliance | Full asset lifecycle management | Comprehensive decision-making, but complex to maintain |
The trade-off here is significant. Adding complexity to your measurement framework improves decision relevance but can make year-on-year and cross-plant comparisons unreliable if not managed carefully. A facility that shifts from classic OEE to MOEE mid-year will find historical comparisons difficult without careful recalibration.
Para otimização da gestão de serviços de campo, similar considerations apply: broader KPIs covering response time, first-fix rates, and technician utilisation tell a richer story than any single metric, but only if they are defined consistently and reviewed against stable baselines. Equally, efficient service scheduling depends on clear, well-documented metrics that technicians and managers understand and can act on without ambiguity.
Pro Tip: If you decide to expand your metrics framework, document the exact definition of each new KPI and record the date of any methodological change. This preserves the integrity of historical trend data and avoids misleading comparisons at senior leadership level.
Applying efficiency metrics in practice: diagnosis to action
Understanding how OEE and its variants are calculated is only half the battle. The greater challenge is translating that data into targeted, effective action on the ground. The risk of treating efficiency as a single aggregate number is that it conceals where losses are coming from, leading teams to apply generic interventions that fail to address root causes.
Here is a practical step-by-step approach for using decomposition to move from diagnosis to action:
- Segment your OEE data. Break down your OEE results by machine, production line, shift, and product type. Aggregated scores are useful for executive reporting, but granular data is what drives improvement.
- Identify the dominant loss category. For each asset or line, determine whether the primary loss is in Availability, Performance, or Quality. This immediately narrows the diagnostic scope and prevents misallocation of resources.
- Conduct root cause analysis within the loss category. If Availability is low, investigate the specific causes: are breakdowns unplanned, is maintenance response time too slow, are there material supply constraints? If Performance is the issue, look at cycle time deviations, minor stoppages, and operator practices.
- Assign improvement actions to specific loss drivers. Each action should directly address a quantified loss. Avoid generic initiatives such as “improve maintenance” in favour of specific interventions such as “reduce mean time to repair on Asset X from 4 hours to 2 hours by implementing planned parts kits.”
- Set measurable targets and review cycles. Agree on what improvement looks like numerically and over what timeframe. Weekly review cadences are typically appropriate for active improvement workstreams.
- Close the loop with data. After implementing changes, verify through data whether the target loss category has improved. If not, return to root cause analysis rather than assuming the intervention was correct.
Pro Tip: Assign improvement actions based on data, not instinct. It is common for experienced engineers to have strong intuitions about where losses occur, but data frequently reveals that the intuition is pointing at the second or third largest contributor rather than the primary one.
Automating workflows for efficiency is a natural complement to this diagnostic process, removing manual reporting delays that slow the feedback loop between data collection and action. Similarly, the ability to streamline maintenance requests ensures that identified issues move from diagnosis to resolution without unnecessary administrative friction.
A perspective from the field: what most leaders miss about efficiency metrics
Having covered the frameworks and practical steps in detail, it is worth addressing a pattern that emerges repeatedly in industrial operations: the pursuit of the highest possible OEE or MOEE score as an end in itself.
This is a more consequential mistake than it might appear. Consider a facility that achieves a 90% OEE score by reducing planned maintenance windows to minimise availability losses. On paper, the number looks excellent. In practice, deferred maintenance accumulates into a fragility that expresses itself later as catastrophic, unplanned failures. The metric improved; the underlying system became less reliable.
The same dynamic plays out with quality metrics. Teams under pressure to improve their Quality component sometimes respond by adjusting inspection thresholds rather than addressing the process variation that creates defects. The score rises; the product quality issue persists.
The deeper issue is that expanded effectiveness metrics reflect a genuine trade-off: more comprehensiveness can improve decision relevance, but it may also shift the calculation methodology in ways that make cross-site or year-on-year comparisons unreliable. When senior leaders tie bonuses or performance reviews to a composite KPI without understanding how it is constructed, the incentive to manipulate inputs becomes significant.
The most effective facility leaders we observe share a common discipline: they treat efficiency metrics as diagnostic tools, not performance targets. They ask “what does this number tell us about where to look?” rather than “how do we make this number higher?” That shift in framing, whilst seemingly subtle, changes everything about how teams respond to data and where improvement efforts are directed.
Operational efficiency measurement, done properly, is a continuous diagnostic conversation between data, process knowledge, and human expertise. It is not a dashboard exercise.
Enhancing your operational efficiency: tools and next steps
Putting the frameworks in this guide into practice requires more than a spreadsheet and good intentions. The right digital tools make the difference between efficiency measurement as a periodic exercise and operational efficiency as a genuinely continuous capability. FullyOps provides a structured approach to alocação de recursos para gestão de ativos, helping operations teams connect their OEE data directly to maintenance scheduling, work order management, and performance analysis. Staying ahead of emerging practices through resources on efficiency-boosting trends in asset management ensures your frameworks remain current. For hands-on implementation, the essential maintenance tracking guide offers practical checklists to support consistent data collection across your asset base.
Perguntas mais frequentes
How do I tell if my facility is truly operationally efficient?
Assess facility efficiency by breaking down OEE by loss category across each line, shift, and asset, then compare against recognised industry benchmarks and monitor trends over consecutive periods rather than relying on a single point-in-time score.
What is the difference between efficiency and effectiveness in operations?
Efficiency focuses on maximising output from given inputs by minimising waste and resource consumption, while effectiveness measures how well operational outcomes align with the strategic goals of the business, such as customer satisfaction or service level compliance.
Should I always use classic OEE to measure efficiency?
Classic OEE provides a reliable and widely understood foundation, but facilities operating in variable or multi-product environments may benefit from modified OEE frameworks that incorporate additional contextual factors, provided those frameworks are defined clearly and applied consistently.
How often should I review my efficiency metrics?
Review key efficiency metrics at a minimum on a weekly basis for active improvement workstreams, and conduct a detailed review following any major equipment incident, process change, or production schedule shift to capture timely insight.
What is the primary cause of low operational efficiency in industrial assets?
Most efficiency losses trace to specific, identifiable issues within the Availability, Performance, or Quality components; decomposing these categories systematically reveals the dominant loss driver and directs resources toward the intervention most likely to deliver measurable improvement.
Recomendado
- Porquê melhorar a alocação de recursos para a eficiência operacional
- 7 Estratégias comprovadas de gestão de recursos para a eficiência dos activos
- O que é manutenção preventiva: guia para gestores de operações
- Aumente a eficiência com auditorias de manutenção: um guia completo