Resumo:
- Operational analytics uses real-time data to support immediate operational decisions, reducing response times. It complements traditional BI by enabling rapid responses, anomaly detection, and decision-ready alerts within existing workflows. Successful implementation depends on unified data architecture, workflow integration, and clear decision policies to drive measurable improvements.
Operational analytics is defined as the practice of applying real-time or near-real-time data analysis to monitor, guide, and improve day-to-day operational decisions. Unlike strategic reporting, it acts on live data streams to reduce mean time to detect (MTTD) and mean time to respond (MTTR) to operational issues. Frameworks from Gartner, tools like Databricks and Scoop Analytics, and the concept of operational intelligence all sit within this discipline. For operations managers and analysts, understanding the role of analytics in operations is the foundation for reducing downtime, cutting costs, and building a genuinely responsive operation.
How does operational analytics differ from traditional BI?
Operational analytics and traditional business intelligence (BI) solve different problems, and conflating them leads to poor tool choices and unmet expectations. Operational analytics processes live data streams to support decisions happening right now, such as whether to reroute a production line or escalate a maintenance ticket. BI, by contrast, is backward-looking. It aggregates historical data to support strategic analysis, trend reporting, and quarterly planning.
The practical difference shows up in response time. A BI dashboard might tell you that machine downtime increased by 12% last month. An operational analytics system tells you that a specific asset is degrading right now and flags it before failure occurs. The former informs strategy; the latter drives action.
Operational intelligence sits as a layer above raw analytics. Decision-ready, exception-driven notifications provide context about what happened, why it happened, and what pattern it fits, rather than simply surfacing a red metric on a screen. This distinction matters because managers who receive alerts without context still face a decision gap.
| Dimensão | Operational analytics | Traditional BI |
|---|---|---|
| Data freshness | Real-time or near-real-time | Historical, batch-processed |
| Primary use | Tactical, day-to-day decisions | Strategic planning and reporting |
| Output type | Contextual alerts, anomaly flags | Dashboards, trend reports |
| Decision horizon | Minutos para horas | Days to months |
| Key metric | MTTD, MTTR | KPIs, variance reports |
Operational analytics complements rather than replaces BI. The two systems manage different control loops: one handles tactical responsiveness, the other supports longer-term benchmarking and planning. Operations teams that treat them as substitutes typically end up with gaps in both.
Which analytics techniques drive operational efficiency?
Several distinct analytical methods underpin modern operational analytics platforms, and each serves a specific purpose within the decision cycle.
- Streaming data pipelines enable continuous ingestion and analysis of sensor, machine, and transactional data. Tools like Databricks Lakeflow process these streams without the latency of batch jobs, making anomaly detection possible within seconds rather than hours.
- Predictive analytics uses historical patterns and machine learning models to forecast future states, most commonly applied to equipment health and demand forecasting. Predictive maintenance models, for instance, estimate remaining useful life (RUL) and flag assets before failure.
- Prescriptive analytics goes further by recommending specific actions under constraints. Decision-centric systems use AI for predictions and optimisation engines to select the best available action rapidly, balancing competing objectives such as cost, availability, and risk.
- Anomaly detection engines monitor operational signals continuously and surface deviations from expected behaviour. These are often embedded directly into operational dashboards, making the output visible to shift leads and planners without requiring them to query a separate system.
- AI and ML model integration embeds trained models into operational workflows so that predictions trigger automated responses or prioritised work orders, rather than sitting in a data science environment disconnected from the shop floor.
The analytics in business operations context is important here. These techniques are not exclusive to manufacturing. Logistics, facilities management, utilities, and field service operations all apply the same methods to different data types, from vehicle telemetry to building management system readings.
Dica profissional: Start with anomaly detection on your highest-cost or highest-risk assets before building out predictive models. Early wins from anomaly detection build organisational trust in data-driven decision making and create the labelled data sets that improve predictive model accuracy over time.

What factors maximise the impact of analytics in operations?
Deploying analytics tools is the straightforward part. Getting them to produce measurable operational improvements requires attention to architecture, workflow design, and organisational behaviour. Four factors consistently determine whether analytics delivers or disappoints.
-
Unified data architecture. Unified namespaces reduce data-integration time by approximately 80% and decision-making cycle times by approximately 40%. This is because data-state consistency and integration latency constrain near-real-time analytics far more than model computation does. If your sensor data, ERP records, and maintenance logs sit in separate systems with no shared schema, your analytics layer will always be working with incomplete or stale information.
-
Workflow embedding. Embedding analytics outputs directly into operational tools closes the last-mile gap. An insight that requires a manager to log into a separate analytics platform, interpret a chart, and then manually update a work order loses most of its value to friction and delay. Alerts and recommendations must reach the person responsible for action within their existing tools and rhythms.
-
Contextual, decision-ready alerts. Raw anomaly flags create alert fatigue. Effective operational intelligence systems investigate the anomaly and deliver a notification that explains what happened, why it is significant, and what the recommended response is. This reduces the cognitive load on shift supervisors and planners, allowing faster and more confident decisions.
-
Analyst and operator collaboration. The last-mile problem is as much organisational as technical. Analysts who build models without understanding operational constraints produce recommendations that frontline teams ignore. Regular collaboration between data analysts and operations roles, including shift leads, maintenance planners, and field technicians, produces analytics outputs that are both technically sound and operationally feasible.
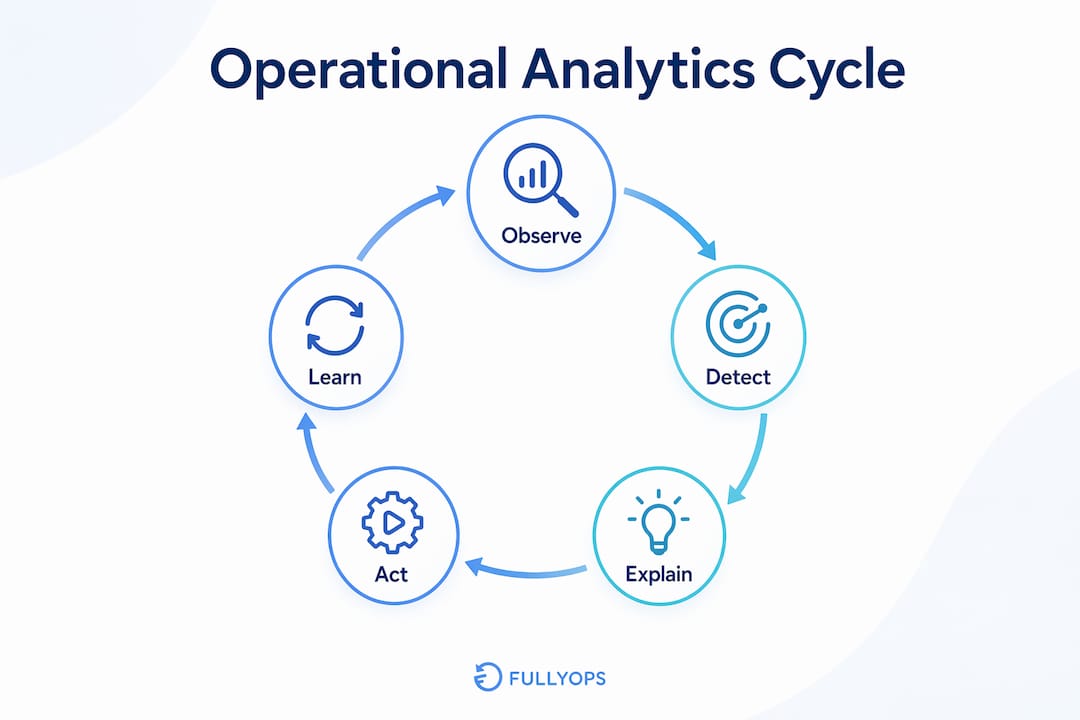
Operational analytics supports a repeatable loop: observe, detect, explain, act, and learn. Each cycle generates feedback that improves the next. Operations teams that close this loop with clear ownership and measurement see compounding efficiency gains over time.
How can predictive analytics transform maintenance and resource allocation?
Predictive and prescriptive analytics deliver their clearest measurable benefits in two areas: maintenance scheduling and resource allocation. Both involve complex trade-offs under constraints, which is precisely where data-driven decision making outperforms intuition and fixed schedules.
In maintenance, the shift from time-based to condition-based intervention is the core value proposition. Predictive maintenance coupled with digital twins reduced unplanned outages by 28% and maintenance costs by 22% in a 2026 study, attributed to higher anomaly detection sensitivity and decision-informed prioritisation. Digital twins create a live model of each asset, allowing the analytics layer to simulate degradation trajectories and recommend intervention timing that minimises both failure risk and unnecessary maintenance spend.
O o papel da análise na manutenção extends beyond scheduling. Explicit operational rules and prioritised interventions based on remaining useful life and risk inform which assets receive attention first, how technician time is allocated, and which spare parts need to be pre-positioned. This is prescriptive analytics in practice: not just predicting failure, but recommending the specific action that best balances cost, risk, and resource availability.
| Use case | Analytical method | Measured outcome |
|---|---|---|
| Unplanned outage reduction | Predictive maintenance with digital twins | 28% reduction in unplanned outages |
| Maintenance cost reduction | Programação baseada em condições | 22% reduction in maintenance costs |
| Decision cycle improvement | Unified data architecture | ~40% faster decision-making cycles |
| Integration latency reduction | Unified namespace architecture | ~80% reduction in data-integration time |
Resource allocation presents a similar pattern. Operations managers balancing technician availability, asset criticality, travel time, and parts availability face a combinatorial problem that spreadsheets handle poorly. Prescriptive analytics platforms evaluate thousands of scenarios in seconds, recommending allocations that optimise across all constraints simultaneously. The impact on operational efficiency is direct: fewer idle technicians, shorter response times, and better asset utilisation.
Dica profissional: When deploying predictive maintenance models, define your decision policies before you deploy the model. Knowing in advance what action a specific risk score triggers, whether that is an immediate work order, a scheduled inspection, or a parts pre-order, prevents the common failure mode where accurate predictions produce no operational change because no one agreed on what to do with them.
Analytics in operations: what most guides get wrong
Most articles on the impact of analytics on operations focus almost entirely on the technology. They discuss platforms, algorithms, and dashboards at length, then treat deployment as a footnote. In my experience, that is exactly backwards.
The technology is the easy part. Databricks, purpose-built operational analytics platforms, and modern CMMS tools have made the analytical capability accessible to operations teams of almost any size. What consistently determines whether those tools produce results is whether the outputs reach the right person, in the right format, at the right moment in their workflow. An alert that arrives 20 minutes after a decision window has closed is not a near-real-time system. It is a slow one.
The other mistake I see repeatedly is treating analytics as a reporting upgrade rather than a decision architecture. Operations managers who deploy dashboards and call it analytics are still making decisions the same way they always did. They are just looking at better charts. The real shift happens when analytics outputs are embedded into work order creation, resource scheduling, and escalation protocols so that the system is actively shaping decisions rather than passively informing them.
The balance between BI and operational analytics also deserves more honest treatment. BI is not obsolete. Monthly trend analysis, budget variance reporting, and capacity planning all require historical aggregation. The organisations that get the most value from analytics are those that use both deliberately: operational analytics for tactical control loops and BI for strategic review. Trying to do both with one tool, or dismissing one in favour of the other, creates blind spots.
Start with a specific, measurable objective. Reduce MTTD on your top five critical assets by 30% in six months. That kind of target forces the right conversations about data quality, workflow integration, and decision ownership. Vague goals produce vague results.
— Pedro
Put analytics to work in your operations with Fullyops
Fullyops is built for operations managers who need analytics embedded directly into their maintenance and field service workflows, not sitting in a separate reporting tool. The platform’s real-time work order dashboard connects operational data to frontline decisions, giving shift leads and planners the context they need without switching systems. For teams working on resource allocation, the tutorial de atribuição de recursos walks through how to optimise technician and asset deployment using live operational data. Fullyops also supports predictive maintenance workflows, automatic reporting, and inventory tracking, making it a practical starting point for teams ready to move from reactive to data-driven operations.
FAQ
What is operational analytics?
Operational analytics is the use of real-time or near-real-time data to monitor and guide immediate operational decisions, reducing mean time to detect and respond to issues. It differs from traditional BI by acting on live data streams rather than historical reports.
How does analytics improve operational efficiency?
Analytics improves efficiency by detecting anomalies earlier, enabling condition-based maintenance, and optimising resource allocation under constraints. Studies show unified data architectures alone can reduce decision-making cycle times by approximately 40%.
What is the difference between predictive and prescriptive analytics in operations?
Predictive analytics forecasts future states, such as equipment failure probability, while prescriptive analytics recommends the specific action to take given those predictions and current constraints. Both are used together in advanced maintenance and scheduling workflows.
What tools are used for operational analytics?
Common analytics tools for operations include Databricks Lakeflow for streaming data pipelines, anomaly detection engines embedded in operational dashboards, and CMMS platforms like Fullyops that integrate predictive maintenance and work order management with live operational data.
Why do operational analytics projects fail?
Most failures occur not from poor models but from poor workflow integration. When analytics outputs are not embedded into the tools and processes that frontline teams already use, insights arrive too late or require too much manual interpretation to drive timely action.
Principais conclusões
Operational analytics delivers measurable results only when its outputs are embedded directly into frontline workflows, supported by unified data architecture, and tied to explicit decision policies.
| Ponto | Detalhes |
|---|---|
| Define before deploying | Set specific targets such as MTTD reduction before selecting tools or building models. |
| Unify your data architecture | Unified namespaces cut integration latency by ~80%, making real-time analytics viable. |
| Embed outputs in workflows | Analytics that requires a separate login or manual interpretation loses most of its operational value. |
| Combine predictive and prescriptive | Predicting failure is only useful when a decision policy defines what action follows each risk score. |
| Use BI and operational analytics together | Operational analytics handles tactical control loops; BI supports strategic planning and benchmarking. |
Recomendado
- O papel da análise de dados na manutenção: um guia prático
- The role of analytics in facilities management
- Como otimizar o desempenho operacional em 2026
- Principais tendências de gestão de instalações 2026: o seu guia estratégico