TL;DR:
- Analytics in facilities management involves collecting and interpreting operational data to enable proactive, evidence-based decisions. Implementing connected sensor systems, digital twins, and AI tools enhances efficiency, reduces costs, and supports compliance through predictive maintenance and real-time monitoring. Success depends on robust data governance, asset mapping, and fostering organizational trust in data-driven processes.
Analytics in facilities management is defined as the systematic collection, integration, and interpretation of operational data to drive evidence-based decisions across maintenance, energy, compliance, and resource allocation. The industry term for this practice is facility performance analytics, and it sits at the heart of modern facilities management (FM). Where traditional FM relied on scheduled inspections and reactive repairs, data-driven facilities now use connected sensors, building management systems (BMS), and machine learning to detect problems before they become failures. Platforms such as Power BI, digital twin technology, and AI copilots from providers like iFactory are reshaping how facility managers interpret building data. This guide covers the technologies involved, the practical applications that deliver the clearest returns, and the implementation pitfalls that undermine even well-funded programmes.
What is the role of analytics in facilities management?
The role of analytics in facilities is to convert raw sensor readings and operational records into decisions that reduce cost, improve reliability, and satisfy compliance requirements. Without analytics, a sensor is simply a data source with no context. OCS highlights that end-to-end connected data enables real-time diagnostics and earlier interventions before disruptions or compliance risks arise. That distinction matters: the value is not in the sensor itself but in the connected system that interprets its output.

Facility performance analytics covers four core domains. First, predictive maintenance uses anomaly detection to flag equipment degradation before failure occurs. Second, energy management uses consumption patterns to identify waste and optimise usage schedules. Third, compliance tracking uses digital records to satisfy statutory duties and environmental reporting. Fourth, resource allocation uses workload data to deploy technicians and materials where they are needed most. Each domain depends on the same underlying capability: a consistent, integrated data model that links every sensor reading to a specific asset, location, and operational context.
What technologies underpin analytics in facilities?
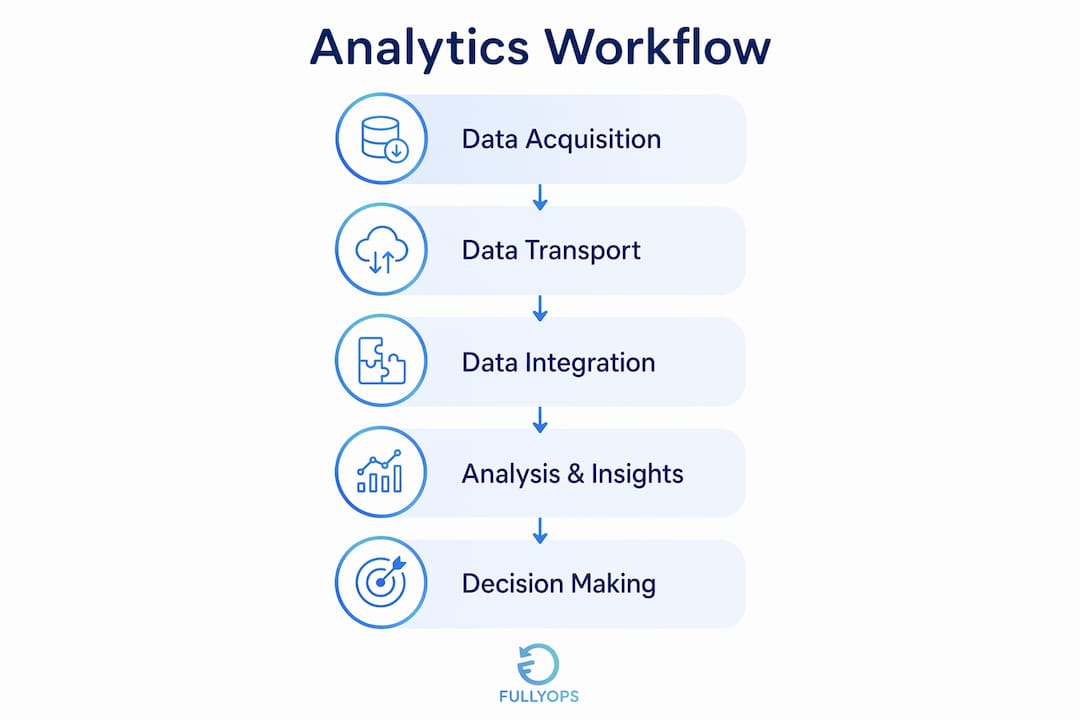
The technological foundation of analytics in facility management rests on four layers: data acquisition, data transport, data storage and modelling, and data visualisation.
Data acquisition begins with IoT sensors embedded in HVAC units, lighting systems, access control panels, and utility meters. These sensors capture temperature, CO2 concentration, humidity, energy draw, and equipment run-time at intervals ranging from seconds to minutes.
Data transport moves sensor readings into a BMS or a cloud data platform. This is where many facilities programmes stall. Sensors alone have limited value; analytics becomes powerful only when sensor data flows into connected building management systems and operational processes. A sensor that logs to a standalone spreadsheet contributes nothing to predictive models.
Data modelling is the layer that most facility managers underestimate. Digital twin technology creates a virtual replica of a building or asset, mapping every sensor point to its physical counterpart and operational mode. Research into LSTM neural networks for predictive maintenance demonstrates forecasting accuracy with an RMSE of 0.04 when sensor data is properly structured and contextualised. That level of precision is only achievable when the data model is clean and consistent.
Data visualisation tools such as Power BI translate model outputs into dashboards that operations teams can act on. Generative AI is now entering this layer: AI copilots like iFactory allow facilities teams to query building data using natural language, automate reporting, and accelerate root cause analysis, saving hours of manual data processing per week.
- Confirm sensor coverage across all critical assets before investing in analytics platforms
- Standardise naming conventions for assets, locations, and sensor types across all sites
- Choose a cloud data platform that supports API integrations with your existing BMS
- Use Power BI or equivalent tools to build operational dashboards accessible to technicians, not just analysts
Pro Tip: Before purchasing any analytics platform, audit your existing data flows. If your sensors do not currently report to a centralised system, fix that first. The analytics layer cannot compensate for broken data plumbing.
How does analytics improve efficiency compared to traditional methods?
Traditional FM operates on two models: reactive maintenance, where teams respond after a failure, and scheduled maintenance, where inspections occur at fixed intervals regardless of actual equipment condition. Both models waste resources. Reactive maintenance incurs emergency labour costs and unplanned downtime. Scheduled maintenance replaces components that still have serviceable life remaining.
Analytics identifies patterns that are difficult to detect through manual checks alone, enabling predictive maintenance and proactive operational responses. Machine learning platforms can compare performance across multiple sites simultaneously, identifying which buildings are outliers and why.
The table below contrasts the two approaches across the dimensions that matter most to operations managers.
| Dimension | Traditional FM | Analytics-driven FM |
|---|---|---|
| Maintenance trigger | Fixed schedule or failure event | Condition-based alert from sensor data |
| Energy monitoring | Monthly utility bills | Real-time consumption dashboards |
| Compliance evidence | Paper records and manual audits | Digital records with automated reporting |
| Resource allocation | Experience and intuition | Workload data and demand forecasting |
| Fault detection speed | Hours to days after failure | Minutes to hours before failure |
One misconception worth addressing directly: more data does not automatically produce better decisions. Practitioners caution that without accurate asset mapping and operational context, predictive signals can be misleading or ignored. A facility generating thousands of sensor readings per minute but lacking a coherent data model will produce noise, not insight.
Pro Tip: Start with one high-value asset class, such as air handling units or chillers, and build a complete analytics workflow for that asset before scaling. Proving value on a narrow scope builds organisational confidence and reveals data quality issues early.
Practical applications: predictive maintenance, energy, and waste reduction
The clearest returns from facility performance analytics come from three application areas: predictive maintenance, energy optimisation, and waste reduction. Each has well-defined implementation steps and measurable outcomes.
Predictive maintenance
Predictive maintenance powered by anomaly detection monitors equipment behaviour continuously and raises alerts when readings deviate from established baselines. A digital twin-enabled system can flag CO2 levels beyond 600 ppm, temperatures outside the 18 to 22°C range, and humidity outside the 50 to 80% band, all of which indicate either equipment fault or occupant health risk. These thresholds are not arbitrary. They reflect the operational conditions under which a building is designed to perform, and deviating from them signals that something has changed.
The predictive maintenance workflow follows a clear sequence:
- Sensors capture real-time readings from target assets
- The analytics platform compares readings against baseline models
- Anomalies trigger alerts routed to the relevant technician via a work order system
- The technician investigates and resolves the issue before failure occurs
- The resolution is logged, updating the baseline model for future reference
Energy management
Real-time energy monitoring allows facilities teams to identify consumption spikes, isolate their source, and adjust schedules or set points accordingly. Analytics enables tracking of material usage, downtime, and production output to reduce waste and improve process efficiency. In practice, this means identifying that a chiller is running at full capacity during off-peak hours because a control parameter was not updated after a building occupancy change.
Compliance and audit readiness
Analytics-driven systems support statutory duties and environmental performance tracking, improving assurance for customers and regulators. Digital records replace manual logs, and automated reports replace periodic audits. For facilities operating under ISO 50001 or similar standards, this capability alone justifies the investment in a connected analytics platform.
| Application | Key metric | Typical alert threshold |
|---|---|---|
| Air quality monitoring | CO2 concentration | Above 600 ppm |
| Thermal comfort | Temperature | Outside 18 to 22°C |
| Humidity control | Relative humidity | Outside 50 to 80% |
| Energy consumption | kWh per occupied hour | Deviation from 7-day baseline |
What are the key challenges in implementing facilities analytics?
Implementing analytics in facility management is a data governance challenge as much as a technology challenge. The most common failure mode is not a lack of sensors or software. It is a lack of consistent data models that connect sensor readings to the assets and processes they are meant to monitor.
The following steps reflect best practice for a structured implementation:
- Define your asset register first. Every sensor must be linked to a specific asset, location, and operational mode. Without this mapping, anomaly alerts cannot be routed to the right team or interpreted correctly.
- Establish operational thresholds with your technical team. Operational teams should define abnormal conditions, such as CO2 above 600 ppm, rather than relying solely on abstract model scores. Thresholds grounded in operational reality produce alerts that technicians trust and act on.
- Schedule regular sensor calibration. Sensors drift over time, particularly in environments with temperature variation or chemical exposure. Calibration schedules should account for seasonal baseline changes, since a temperature reading that was normal in July may indicate a fault in January.
- Invest in team capability alongside technology. Analytics platforms surface insights; people operationalise them. Technicians need training to interpret dashboards, and managers need processes to act on alerts within defined response windows.
- Integrate your analytics platform with your work order system. An alert that does not automatically generate a digital work order adds manual steps that slow response times and create audit gaps.
Cultural adoption is the final and often underestimated challenge. Teams accustomed to experience-based decision-making can be resistant to data-driven recommendations, particularly when the model flags an asset that “seems fine.” Building trust in the system requires transparency: show technicians the data behind each alert and involve them in calibrating thresholds.
Pro Tip: Assign a data steward within your facilities team, not just an IT contact. This person owns the asset register, monitors data quality, and acts as the bridge between operational knowledge and the analytics platform.
Key takeaways
Facility performance analytics delivers its greatest value when sensor data, asset models, and operational workflows are fully integrated rather than managed in isolation.
| Point | Details |
|---|---|
| Integration over sensors | Connected data flows, not individual sensors, are what make analytics operationally useful. |
| Defined thresholds matter | Operational teams must set meaningful alert thresholds, such as CO2 above 600 ppm, to produce trustworthy signals. |
| Predictive beats reactive | Condition-based maintenance reduces unplanned downtime and avoids replacing components with remaining service life. |
| Data governance is foundational | A clean asset register and consistent data model are prerequisites for accurate predictive analytics. |
| People and process complete the system | Analytics platforms surface insights, but trained teams and integrated work order processes determine whether those insights become action. |
Analytics in facilities: what experience actually teaches you
The conversation around analytics in FM tends to focus on technology. New sensors, better algorithms, more dashboards. In practice, the facilities teams that extract the most value from analytics are not the ones with the most sophisticated tools. They are the ones that spent time getting their data foundations right before scaling.
I have seen organisations invest significantly in machine learning platforms only to discover that their asset registers were incomplete, their sensor naming conventions were inconsistent across sites, and their BMS had not been updated to reflect building modifications made years earlier. The platform was capable. The data was not.
The shift from reactive to predictive maintenance is real and the returns are genuine, but it does not happen because you deployed a digital twin. It happens because someone took the time to map every sensor to the right asset, define what “normal” looks like for each piece of equipment, and build a process that routes alerts to the right person within a response window that actually matters.
The next wave of capability, AI copilots and augmented reality for remote diagnostics, will amplify these foundations. It will not replace them. Facilities managers who want to be ready for that wave should focus now on analytics in maintenance as a discipline, not just a technology purchase. The organisations that will lead in 2026 and beyond are the ones building clean, connected, well-governed data systems today.
— Pedro
How Fullyops supports analytics-driven facilities management
Fullyops is a SaaS platform built for facilities and industrial maintenance teams that need to move from reactive to data-driven operations. Its operations analytics module gives managers real-time visibility into work order status, technician performance, and asset health across multiple sites. Alerts from connected systems flow directly into digital work orders, closing the gap between insight and action. For teams looking to structure their approach to resource allocation, the Fullyops resource allocation tutorial provides a practical framework for deploying people and materials based on operational data rather than habit. If you are building or refining your analytics programme, Fullyops offers the integrations and reporting infrastructure to support it at scale.
FAQ
What is the role of analytics in facilities management?
Analytics in facilities management is the process of collecting, integrating, and interpreting operational data to support decisions on maintenance, energy, compliance, and resource allocation. Its primary function is to shift facilities teams from reactive responses to condition-based, predictive operations.
How does predictive maintenance differ from scheduled maintenance?
Predictive maintenance uses real-time sensor data and anomaly detection to trigger interventions based on actual equipment condition, while scheduled maintenance operates on fixed time intervals regardless of asset health. Predictive approaches reduce both unplanned downtime and unnecessary component replacement.
What data is needed to start using analytics in a facility?
A functioning analytics programme requires sensor data linked to a structured asset register, a centralised data platform or BMS, and defined operational thresholds for key parameters such as temperature, CO2, and energy consumption. Data quality and consistent asset mapping matter more than sensor volume.
Why do analytics implementations fail in facilities?
The most common cause of failure is poor data governance: incomplete asset registers, inconsistent sensor naming, and disconnected systems that prevent data from flowing into a unified model. Technology alone cannot compensate for fragmented or inaccurate underlying data.
How can facilities teams use AI in analytics programmes?
Generative AI copilots, such as those offered by iFactory, allow facilities teams to query building data using natural language, automate routine reports, and accelerate root cause analysis. These tools work most effectively when the underlying data model is clean and well-structured.
Recommended
- Role of analytics in maintenance: a practical guide
- Top facility management trends 2026: your strategic guide
- Facility management checklist: boost efficiency and asset control