

Design failure mode and effects analysis, applied to maintenance, means using FMEA to identify how equipment fails, ranking those failure modes by risk, and converting the highest-risk ones into prioritised maintenance work. It is not a design-engineering exercise for new products. It is a working method for deciding what your technicians should inspect, lubricate, replace or monitor, and why.
If you manage assets and want to start this week, here is the fastest path in:
- Pick one critical asset (a pump, a compressor, an HVAC unit) with a recent history of breakdowns.
- Pull twelve months of work-order history from your CMMS and any FRACAS (Failure Reporting, Analysis and Corrective Action System) records you have.
- Book a 60 to 120 minute kick-off with Operations, Maintenance and Engineering in the room.
- Flag any change this produces for Management of Change (MOC) sign-off before it touches the maintenance schedule.
Dica profissional: Don’t wait for a perfect data set. A single asset with six months of decent work-order history is enough to run a useful first Phase 1 session.
Principais conclusões
Design failure mode and effects analysis works because it forces maintenance decisions to follow evidence from CMMS and FRACAS data rather than habit or guesswork.
| Ponto | Detalhes |
|---|---|
| Start with one critical asset | Pick a high-criticality asset with at least six months of work-order history for your first FMEA cycle. |
| Assign a cross-functional team | Include Operations, Maintenance, Engineering, Materials and EHS, with one dedicated facilitator. |
| Prioritise the top 20% RPN | Rank failure modes by RPN and act on the highest quintile, with a severity-9/10 override rule. |
| Track actions in a CMMS | Every mitigation task needs an owner, frequency, success criteria and linked FMEA row ID. |
| Review annually and after failures | Update the FMEA on a fixed cadence, not on an informal “when we remember” basis. |
| Use a platform built for traceability | Fullyops links FMEA row IDs to CMMS work orders so effectiveness data flows back automatically. |
Over the next 30 days, select your pilot asset, pull the data, and run the Phase 1 session. In the following 60 days, score risk, get sign-off on top-priority actions, and load them into your CMMS. By day 90, recalculate OEE against your baseline and report the change to whoever owns the maintenance budget.
Índice
- What is design failure mode and effects analysis in maintenance planning?
- How to choose which assets to analyse first
- What data and documents you need before Phase 1
- Phase 1: mapping functions, failure modes and current controls
- Phase 2: scoring risk and deciding what to fix first
- Turning FMEA actions into tracked work orders
- How to keep the FMEA living instead of letting it go stale
- Templates, tools and the software features that make this work
- Common pitfalls, limitations and governance guardrails
- A practitioner’s view on running maintenance FMEA sessions
- Where a maintenance platform fits into this process
- Sources
- FAQ
What is design failure mode and effects analysis in maintenance planning?
Put simply: FMEA turns guesswork into a ranked list of what to fix first. Plant Services argues that FMEA should sit at the centre of your equipment maintenance plan (EMP), not as a one-off compliance exercise but as the engine that decides what preventive tasks exist and why.
The mechanism is straightforward. You map how an asset can fail, score each failure mode for severity, likelihood and detectability, then route the worst offenders into maintenance tasks with owners and deadlines. Done properly, this pulls three levers at once: fewer surprise breakdowns, lower total cost of ownership, and a measurable lift in overall equipment effectiveness (OEE).
Three numbers are worth tracking before and after a maintenance FMEA cycle:
- OEE — the composite score of availability, performance and quality.
- Unplanned downtime hours — the clearest proxy for reliability gains.
- Percentage of work that is corrective versus preventive — a shift towards preventive work is the clearest sign the FMEA is doing its job.
Plant Services notes that teams who reassess a year after implementation and recalculate OEE can point to a concrete before-and-after picture rather than a vague sense that “things feel better.”
How to choose which assets to analyse first
Not every asset deserves the same attention in week one. Run a short criticality analysis before you touch a single failure mode.
- Score safety impact. Could a failure hurt someone or trigger a regulatory breach? Weight this heaviest.
- Score production impact. Does this asset stop the line, or does redundancy absorb the failure?
- Score repair cost and downtime duration. A cheap part with a six-week lead time can outrank an expensive one sitting on the shelf.
- Score spare-parts availability. Long lead times on obsolete components push an asset up the list even if failure frequency is low.
- Rank and select the top three to five assets for your first FMEA cycle rather than trying to cover the whole site at once.
Assemble a cross-functional team before the first session: Operations, Maintenance, Engineering, Materials (for spares and lead times), and EHS (for safety-critical failure modes), with one person facilitating so the discussion doesn’t stall on jargon. A single pump with a straightforward failure history might need one 90-minute session. A multi-stage compressor train with interacting subsystems can easily need two or three sessions spread across a week, because the functional breakdown alone takes longer to agree.
What data and documents you need before Phase 1
Walking into a Phase 1 session without data wastes the room’s time on guesswork instead of analysis. Gather these before you schedule anything:
- CMMS work-order history (failures, repairs, parts consumed)
- FRACAS or equivalent failure-reporting records
- Equipment drawings and P&IDs
- Asset utilisation data (run hours, cycles, load profiles)
- Safety and near-miss logs tied to the asset
- OEM specifications and operating limits
Twelve months of history is the ideal minimum; anything less and seasonal or cyclical failure modes may not show up. Six months is workable if the asset runs continuously and failure frequency is high enough to generate a usable pattern. Whoever facilitates the session should own the data pull and give the file a clear version number, because a maintenance FMEA that gets updated eighteen months later without a naming convention becomes very hard to trust.
Phase 1: mapping functions, failure modes and current controls
Phase 1 is where the team names what the equipment is supposed to do, then works backwards to how it fails. Each row in the worksheet should follow the same structure: function → functional failure → component → failure mode → effect → cause → current control → current detection frequency.
Here’s what one completed row looks like for a centrifugal pump:
| Função | Functional failure | Component | Failure mode | Effect | Causa | Current control |
|---|---|---|---|---|---|---|
| Transfer fluid at rated flow | No flow / reduced flow | Mechanical seal | Seal wear/leak | Product loss, contamination risk | Dry running, misalignment | Monthly visual inspection |
| Transfer fluid at rated flow | Vibration exceeds limit | Bearing | Bearing degradation | Unplanned shutdown, secondary damage | Lubrication failure, overload | Quarterly vibration check |
The trap most teams fall into is vague wording. “Pump breaks” is not a failure mode; “mechanical seal wear leading to leak” is. Push operators, not just engineers, to describe what they actually see and hear before a failure. Operators often catch failure modes engineers never see, because they are standing next to the equipment when it starts to behave oddly. Forge Reliability recommends prepopulating rows from CMMS and FRACAS data before the session, so the room spends its time validating and refining rather than starting from a blank page.
Dica profissional: Ask “what would we see, hear, or smell first?” rather than “how does it fail?” — it draws out the early warning signs your current controls should be catching.
Phase 2: scoring risk and deciding what to fix first
Once every row has a failure mode, cause and current control, score each one using the standard FMEA formula:
RPN = Severity (SEV) × Occurrence (OCC) × Detection (DET)
Each factor is typically scored on a 1 to 10 scale. Severity measures how bad the effect is; occurrence measures how often the failure happens; detection measures how likely your current controls are to catch it before it causes damage (a low detection score means poor detectability, which is often the weakest link in ageing plants).
Rank every row by RPN and start mitigation planning with the top 20%, which Plant Services recommends as a practical cutoff for most sites. Apply one override rule: any failure mode with a severity score of 9 or 10, regardless of its overall RPN, gets escalated immediately. A low-frequency failure that could injure someone doesn’t get to wait its turn in the queue.
RPN has real limits. Two failure modes with wildly different risk profiles can land on the same number, and research on time-dependent FMEA shows that failure probability for wear-related components climbs as the asset ages, meaning a static RPN calculated once can understate risk a year later. For assets with strong wear curves, either recalculate RPN periodically or adopt an AIAG/VDA-style Action Priority approach, which weighs severity more heavily than a pure multiplication does.
Turning FMEA actions into tracked work orders
An FMEA that stays in a spreadsheet changes nothing. Every mitigation idea needs to become a CMMS action with the following fields:
- Title and linked FMEA row ID so the action traces back to its source.
- Owner — a named person, not a department.
- Frequência — how often the task runs (weekly inspection, quarterly overhaul, condition-triggered).
- Success criteria — what “done correctly” looks like, not just “done.”
- Cost estimate and due date for budget tracking and accountability.
- MOC flag — mark whether this action changes an existing procedure, in which case it needs formal Management of Change sign-off before it goes live.
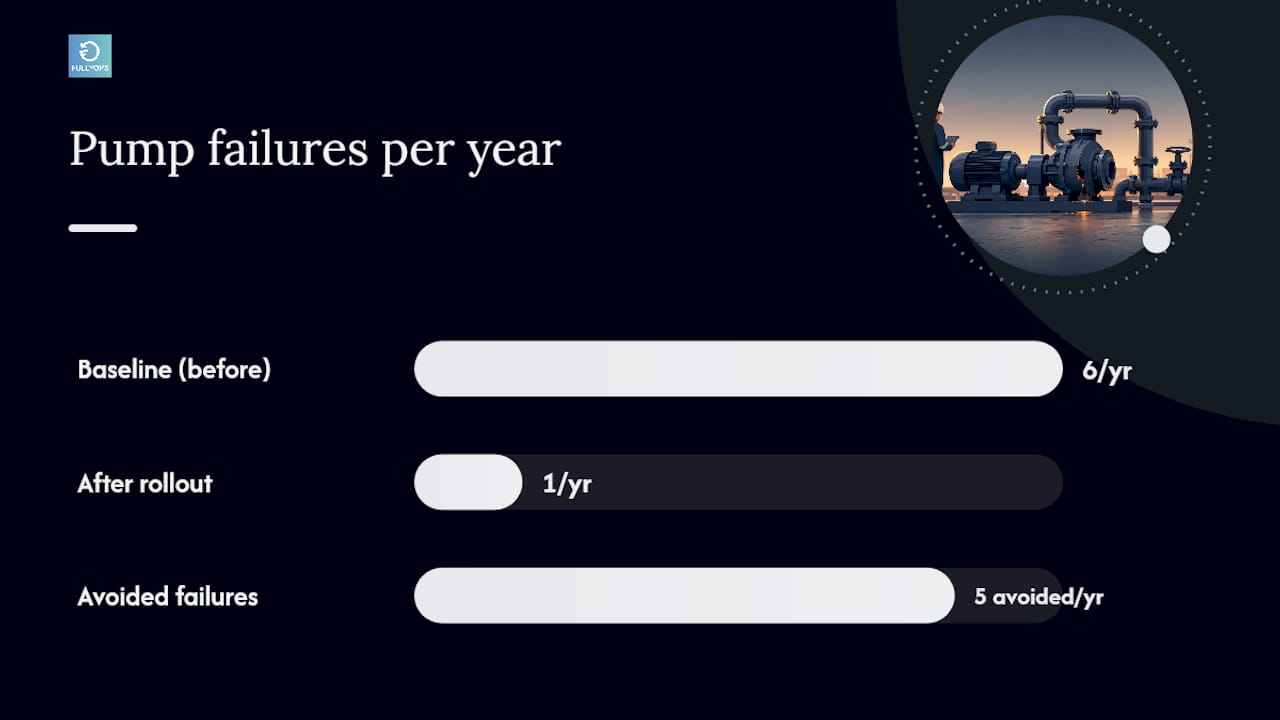
Get process-owner sign-off on the top-ranked actions, lock in due dates, and enter them directly into your gestão de ordens de trabalho system so closure and effectiveness get tracked automatically rather than chased manually. A year after full rollout, recalculate OEE and compare it to your baseline. If a pump’s mechanical seal failures dropped from six a year to one, and each failure previously cost four hours of downtime plus parts, the savings calculation writes itself: roughly five avoided failures multiplied by your fully loaded downtime cost per hour.
A platform like Fullyops maps each FMEA action directly to a CMMS work order with the linked row ID preserved, so when a technician closes the task, the effectiveness data flows back to the original failure mode automatically instead of sitting in a separate spreadsheet nobody updates.
How to keep the FMEA living instead of letting it go stale
A PhD study on FMEA in asset maintenance found that most FMEAs become static shortly after handover, because nobody owns the feedback loop back into the worksheet. Set a review cadence before you close the first session, not after it has already gone stale.
| Gatilho | Cadence | Who signs off |
|---|---|---|
| Scheduled review | Annually | Maintenance manager + facilitator |
| Significant failure | Immediately after root cause is confirmed | Maintenance manager |
| Process or design change | Before change goes live (via MOC) | Engineering + Operations |
Every repair root cause, near-miss report and inspection finding should route back to the relevant FMEA row, updating the occurrence or detection score if the pattern has shifted. A commercial facility maintenance guide on review cadences makes a similar point: maintenance plans that never get revisited drift away from actual asset behaviour within a year or two, regardless of how good the initial analysis was.
Templates, tools and the software features that make this work
A maintenance FMEA lives or dies on how easily its outputs move into daily work. At minimum, your software needs:
- A structured FMEA table import (not a locked PDF)
- Linkable FMEA row IDs that persist through CMMS work orders
- Work-order templating so mitigation tasks don’t need re-entry from scratch
- Scheduled triggers for time-based or condition-based tasks
- Dashboards showing RPN trends alongside OEE and downtime
Mapping a template row to a CMMS field takes three steps: match the failure mode description to the work-order title, copy the assigned frequency into the scheduling rule, and set the FMEA row ID as a custom field so reporting can filter by source. Fullyops supports this structure directly, with análise de operações dashboards that surface RPN and OEE trends side by side, and feature coverage built around exactly this kind of traceable, action-to-work-order mapping.
Common pitfalls, limitations and governance guardrails
Most maintenance FMEAs fail for the same handful of reasons, and each one has a specific fix.
- Static FMEA that never updates. Fix: assign a named owner and a fixed annual review date, not a vague “as needed” commitment.
- Poor detection scoring. Fix: base DET scores on actual inspection frequency and sensor coverage, not optimistic assumptions.
- No action-tracking after the workshop. Fix: every top-20% action gets a CMMS work order before the meeting closes, not weeks later.
- Weak facilitation. Fix: use a facilitator experienced enough to keep the room specific and push back on vague failure-mode descriptions.
Some failure modes need immediate escalation regardless of their calculated RPN. A severity score of 9 or 10, tied to a plausible safety or environmental consequence, should trigger engineering review straight away rather than waiting for the next scheduled meeting. Governance matters just as much as the analysis itself: keep version control on the FMEA file, route any procedural change through MOC, and audit a sample of closed actions every year to confirm they actually reduced failures rather than just closing the paperwork.
A practitioner’s view on running maintenance FMEA sessions
The teams that get the most from FMEA treat the first session as a starting point, not a finished product. Momentum matters more than perfection: a rough Phase 1 worksheet that gets revisited every quarter beats an exhaustive one that sits untouched for two years.
One pattern shows up repeatedly in plants that do this well. A site running a fleet of process pumps kept losing one unit to bearing failure roughly every ten weeks, each event costing several hours of unplanned downtime and a rushed parts order. A short FMEA session flagged lubrication frequency as under-scheduled relative to actual run hours, not equipment quality. Moving the lubrication task from a fixed monthly interval to a run-hour-triggered schedule, tracked through the CMMS, cut failures on that pump to roughly one a year. Nothing about the pump changed. The maintenance task simply matched the actual failure mechanism instead of a generic calendar interval.

That’s the real value of design failure mode and effects analysis applied to maintenance: it replaces assumptions about how equipment fails with evidence, and it gives you a defensible reason for every task on the schedule.
Where a maintenance platform fits into this process
Running an FMEA on paper or in a spreadsheet works for the first session. Keeping it alive for years, across dozens of assets, is where most teams lose the thread, because nobody wants to manually re-link a hundred FMEA rows to work orders every time a technician closes a job. Fullyops closes that gap by keeping the FMEA row ID attached to its work order from creation through closure, so effectiveness data feeds back automatically instead of depending on someone remembering to update a spreadsheet.
For a manager choosing between spreadsheet tracking and a dedicated system, the practical difference shows up at review time: a resource allocation guide can help you decide who owns which actions, while the work order management dashboard gives you the RPN-to-OEE trail an annual audit actually needs. If you’re weighing software options for a living FMEA programme, the maintenance software comparison page lays out where Fullyops fits against the feature checklist covered above. Book a walkthrough to see how your own asset data would map into it.
Sources
- FMEA (ASQ)
- Making FMEA the heart of an equipment maintenance plan | Plant Services
- FMEA for Maintenance Teams: A Step-by-Step Approach (Forge Reliability)
FAQ
What is design failure mode and effects analysis in maintenance?
It is FMEA applied to physical assets: identifying how equipment fails, scoring the risk of each failure mode, and converting the highest-risk ones into prioritised maintenance tasks.
How is RPN calculated in a maintenance FMEA?
RPN equals Severity multiplied by Occurrence multiplied by Detection, each typically scored from 1 to 10, giving a ranking number used to prioritise mitigation work.
How often should a maintenance FMEA be reviewed?
Review it annually as standard practice, and immediately after any significant failure or process change, following the cadence Plant Services recommends.
Which team members should be involved in an FMEA session?
Include Operations, Maintenance, Engineering, Materials and EHS representatives, led by a facilitator who keeps failure-mode descriptions specific rather than vague.
Can Fullyops help manage FMEA outputs?
Yes. Fullyops links FMEA row IDs directly to CMMS work orders, so mitigation actions, closure data and OEE trends stay traceable back to the original failure mode.