Resumo:
- Real-time monitoring continuously collects and analyzes operational data to enable immediate asset performance insights. It uses lightweight agents, stream processors, and visualisation tools to detect anomalies quickly, reducing downtime and improving maintenance accuracy. Success depends on proper architecture, integrated workflows, and operational discipline for optimal results.
Real-time monitoring is defined as the automated, continuous collection and analysis of operational data with minimal latency, delivering immediate visibility into asset performance and system health. Unlike traditional scheduled checks, it processes telemetry data including metrics, logs, traces, and events as they occur, enabling maintenance professionals and operations managers to detect anomalies before they escalate. Tools such as Prometheus, Grafana, and PagerDuty sit at the centre of most modern implementations, while kernel-level technologies like eBPF have made data collection far less resource-intensive than older polling methods.
What is real-time monitoring and how does it work in operational settings?
Real-time monitoring works by deploying lightweight agents or collectors directly onto assets, servers, or industrial equipment to gather telemetry data continuously. These agents transmit data to a processing layer, where stream processors and time-series databases analyse it within seconds. Latency targets range from sub-second to 60 seconds, a dramatic improvement over the 5 to 15 minute polling intervals typical of traditional monitoring. For operations teams managing dozens of machines or field assets, that difference determines whether a fault is caught early or becomes a costly failure.
The technical architecture behind effective real-time data tracking follows a well-established pattern:
- Agents and collectors deploy on monitored assets to capture CPU usage, temperature, pressure, error rates, and other operational metrics
- Kernel-level tools such as eBPF run sandboxed programs directly in the operating system kernel, providing deep visibility with near-zero CPU overhead
- Message queues such as Apache Kafka buffer and route high-volume data streams to downstream processors
- Stream processors such as Apache Flink and Apache Storm apply filtering, aggregation, and anomaly detection rules in motion
- Time-series databases such as InfluxDB and TimescaleDB store the processed data for querying and trend analysis
- Dashboards such as Grafana visualise live data, while alerting integrations with platforms like PagerDuty trigger incident workflows automatically
Dica profissional: When configuring collection intervals, collecting data every 10 seconds is a widely used baseline. Going significantly faster without edge aggregation can exhaust agent resources and degrade the performance of the very assets you are monitoring.
Alerting logic operates on two levels. Static thresholds trigger when a metric crosses a fixed boundary, such as a motor temperature exceeding 85°C. Dynamic anomaly detection learns baseline behaviour over time and flags deviations even when absolute thresholds are not breached. Both approaches are necessary for mature real-time performance tracking in industrial environments.
What are the benefits of real-time monitoring for asset management?
The operational case for real-time monitoring rests on four measurable outcomes: faster detection, faster resolution, lower downtime costs, and improved maintenance accuracy.
- Reduced mean time to detect (MTTD) and mean time to resolve (MTTR). Capturing anomalies as they occur enables incident response teams to act within minutes rather than hours, preventing minor faults from cascading into production stoppages.
- Predictive maintenance accuracy. Advanced implementations increase predictive maintenance accuracy by 45% by correlating live sensor data with historical failure patterns. For maintenance professionals managing HVAC systems, industrial machinery, or automotive fleets, this directly reduces unplanned replacement costs.
- Infrastructure consolidation. Platforms that unify time-series, graph, document, and vector data into a single engine, such as ArcadeDB, consolidate multiple data types and reduce the number of separate tools a team must manage.
- Lower total cost of ownership. High-performance streaming ingestion engines deliver up to 60% lower TCO compared to legacy batch ETL pipelines, with insight delivery up to 10 times faster.
- Continuous improvement. Live operational data feeds directly into waste reduction and process optimisation cycles, giving operations managers the evidence base to justify maintenance schedule changes or capital investment decisions.
“The shift to real-time monitoring is driven by the need to minimise downtime via faster detection and resolution of incidents.” This is not a technology preference. It is a business continuity requirement for any organisation where unplanned downtime carries a direct financial cost.
For maintenance teams managing gestão do ciclo de vida dos activos across multiple sites, the importance of real-time monitoring extends beyond individual fault detection. It creates a continuous feedback loop between field conditions and management decisions.
How does real-time monitoring compare to traditional monitoring?
Understanding the difference between the two approaches helps operations managers make the right investment decision for their environment.
| Característica | Traditional monitoring | Monitorização em tempo real |
|---|---|---|
| Polling interval | 5 to 15 minutes | Sub-second to 60 seconds |
| Alert delay | Minutos para horas | Seconds to minutes |
| Data freshness | Stale by design | Current by design |
| Storage demand | Mais baixo | Higher without edge filtering |
| Compute cost | Mais baixo | Moderate to high |
| Mais adequado para | Stable, low-criticality assets | High-value, dynamic, or safety-critical assets |
| TCO over time | Higher due to incident costs | Lower with proper architecture |
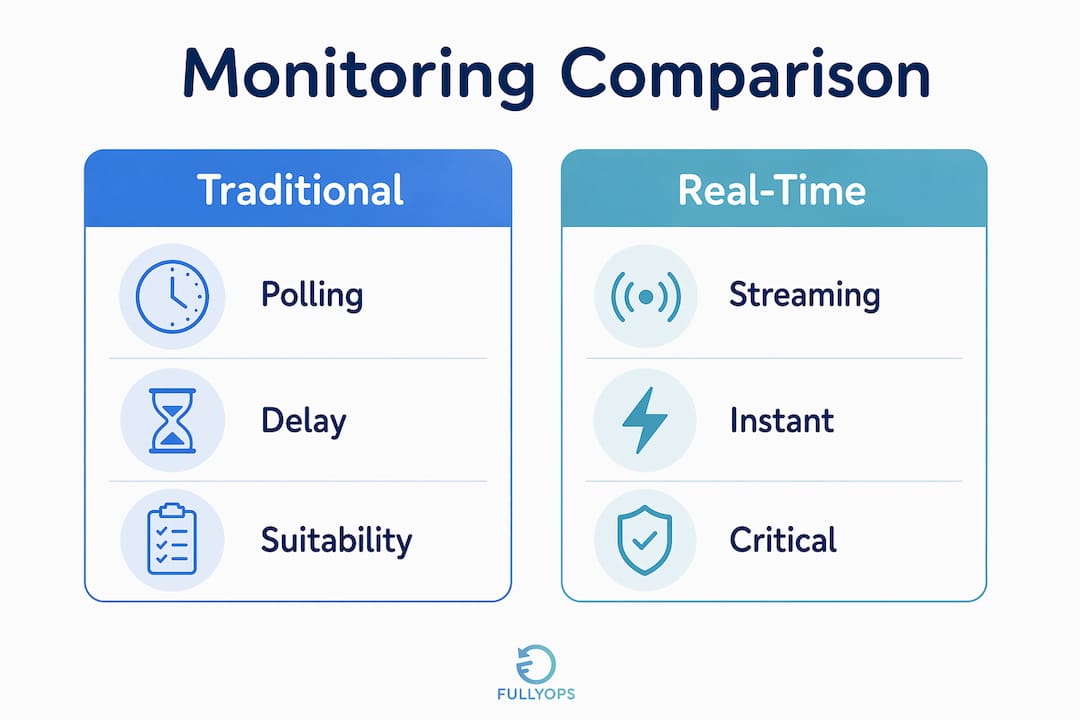
Traditional monitoring suits environments where assets change slowly and brief delays in fault detection carry low risk. Real-time data tracking is the correct choice when asset failure carries significant financial, safety, or reputational consequences. A manufacturing line, a refrigeration unit in a food distribution centre, or a field pump in a water treatment facility all fall into the latter category.
Dica profissional: Do not replace traditional monitoring wholesale. Use real-time monitoring for critical assets and high-frequency failure modes, and retain scheduled checks for low-risk, low-change infrastructure. The hybrid approach controls cost while maintaining coverage.
The TCO argument for real-time systems strengthens over time. The upfront cost of streaming infrastructure is offset by reductions in emergency repair costs, production losses, and the labour hours spent investigating incidents that could have been prevented.
What tools and steps are needed to implement real-time monitoring?
Effective implementation follows a structured sequence rather than a technology-first approach. Operations teams that select tools before defining their data requirements consistently over-engineer their stack and under-deliver on alerting quality.
The core implementation steps are:
- Define what to monitor. Identify the assets, metrics, and failure modes that carry the highest operational risk. Temperature, vibration, pressure, error rates, and throughput are common starting points for industrial environments.
- Select appropriate agents. Choose agents that match your asset type. For IT infrastructure, tools like Prometheus exporters or eBPF-based collectors work well. For industrial equipment, OPC-UA connectors or purpose-built IoT agents are more appropriate.
- Choose a streaming architecture. Real-time monitoring systems typically include Kafka for message queuing, Flink or Storm for stream processing, and InfluxDB or TimescaleDB for time-series storage. Select components that your team can operate and maintain.
- Build dashboards in Grafana. Grafana connects natively to most time-series databases and provides the live visualisation layer that maintenance teams use during shift handovers and incident response.
- Establish alerting rules. Configure both static thresholds and dynamic anomaly detection. Route alerts to PagerDuty or equivalent incident management platforms to trigger work order creation automatically.
- Apply edge aggregation. Balancing data collection intervals and pre-filtering data at the edge reduces storage costs and prevents alert fatigue without sacrificing detection accuracy.
For teams managing field service efficiency, integrating real-time alerts directly into work order management workflows is the step that converts monitoring data into maintenance action. Without that integration, alerts remain notifications rather than triggers for resolution.
What challenges should businesses consider with real-time monitoring?
Real-time monitoring is not a complete solution on its own, and several common misconceptions lead organisations to implement it poorly.
The most significant misconception is that real-time monitoring replaces root cause analysis. Monitoring is the fire alarm; observability is the investigator that explains why an issue occurred. Tools like Grafana and PagerDuty tell you that something is wrong and when it started. Observability platforms that correlate traces, logs, and metrics tell you why. Both are necessary for mature incident management.
Other challenges worth addressing before deployment:
- Alert fatigue. Without intelligent filtering and well-tuned thresholds, high-frequency monitoring generates noise that desensitises teams to genuine alerts. Edge aggregation and anomaly detection tuning are the primary mitigations.
- Data ingestion method trade-offs. Push-based ingestion, where agents send data to a central collector, scales better for large asset fleets. Pull-based ingestion, where the collector requests data from agents, is simpler to configure but creates bottlenecks at scale.
- Integration with incident workflows. Monitoring data only creates value when it triggers a defined response. Connecting alerts to processos de gestão de ordens de trabalho closes the loop between detection and resolution.
- Cost of storage at scale. High-frequency data from hundreds of assets accumulates quickly. Retention policies, data downsampling, and tiered storage are standard practices for controlling costs without losing historical visibility.
Principais conclusões
Real-time monitoring delivers measurable operational advantage only when its architecture, alerting logic, and incident workflows are designed together rather than in isolation.
| Ponto | Detalhes |
|---|---|
| Latency is the defining difference | Real-time monitoring targets sub-second to 60-second updates versus 5 to 15 minutes for traditional polling. |
| Predictive maintenance accuracy improves | Advanced implementations increase predictive maintenance accuracy by 45%, reducing unplanned failures. |
| Monitoring and observability are distinct | Monitoring alerts to problems; observability tools investigate their root cause. Both are required. |
| Architecture matters before tools | Define critical assets and failure modes before selecting Kafka, Flink, InfluxDB, or Grafana. |
| Integration drives resolution | Connecting alerts to work order workflows converts monitoring data into maintenance action. |
Why real-time monitoring is only as good as the team behind it
From working closely with operations and maintenance teams across industrial environments, the pattern I see most often is this: organisations invest in the technology stack and underinvest in the operational processes that make it useful. A Grafana dashboard showing live asset data is genuinely valuable. A Grafana dashboard whose alerts are routed to an inbox that nobody checks during night shifts is not.
The teams that extract the most value from real-time performance tracking are the ones that treat it as an operational discipline, not a software deployment. They define escalation paths before going live. They review alert thresholds quarterly. They connect monitoring outputs directly to predictive maintenance schedules so that data informs action rather than sitting in a database.
The next frontier is AI-driven anomaly detection, where models trained on asset-specific historical data replace static thresholds entirely. Several industrial monitoring platforms are already moving in this direction, and the accuracy improvements are significant. That said, AI-driven detection still requires the same foundational work: clean data, well-defined assets, and integrated incident workflows. The technology does not substitute for operational rigour.
My honest advice is to start with three to five critical assets, build the full detection-to-resolution workflow for those assets first, and then scale. Organisations that try to monitor everything from day one typically end up monitoring nothing effectively.
— Pedro
How Fullyops supports real-time asset monitoring in practice
Fullyops is built for operations managers and maintenance professionals who need more than a monitoring dashboard. The platform connects real-time asset data to gestão de ordens de trabalho, resource allocation, and operational reporting in a single environment. When an alert fires, Fullyops can trigger a work order, assign the right technician, and log the intervention automatically, closing the gap between detection and resolution that most monitoring-only tools leave open. For teams looking to align their monitoring investment with a structured asset management approach, the asset management systems guide on Fullyops is a practical starting point. You can also explore the tutorial de atribuição de recursos to see how live operational data translates into better maintenance planning.
FAQ
What is real-time monitoring in simple terms?
Real-time monitoring is the automated, continuous observation of asset or system performance data with minimal delay, typically updating every second to 60 seconds. It enables operations teams to detect faults and anomalies as they occur rather than discovering them during scheduled checks.
How does real-time monitoring differ from traditional monitoring?
Traditional monitoring polls assets on 5 to 15 minute intervals, meaning faults can go undetected for extended periods. Real-time monitoring processes data continuously, reducing alert delays from minutes or hours to seconds.
What are the main benefits of real-time monitoring for maintenance teams?
The primary benefits are faster fault detection, reduced mean time to resolve incidents, improved predictive maintenance accuracy, and lower total cost of ownership compared to reactive maintenance approaches.
What tools are commonly used for real-time monitoring?
Common tools include Prometheus and Grafana for metrics collection and visualisation, Apache Kafka and Apache Flink for stream processing, InfluxDB and TimescaleDB for time-series storage, and PagerDuty for incident management and alerting.
Does real-time monitoring replace root cause analysis tools?
No. Real-time monitoring identifies that a problem exists and when it started. Observability platforms that correlate logs, traces, and metrics are still required to determine why the problem occurred and how to prevent recurrence.
Recomendado
- Maintenance trends in 2026: what you need to know
- Como otimizar o desempenho operacional em 2026
- Smart maintenance in 2026: what you need to know
- Gestão de ordens de trabalho com painel de controlo em tempo real