TL;DR:
- Equipment performance analysis uses metrics like OEE to assess machine effectiveness, combining availability, performance, and quality. Success relies on disciplined data collection, focusing on root causes of the Six Big Losses, and validating equipment through structured qualification phases. Prioritizing one loss category at a time and ensuring measurement integrity leads to measurable operational improvements.
Equipment performance analysis is the systematic process of measuring how effectively industrial machinery converts available time into quality output, using metrics such as availability, performance rate, and quality yield. The recognised industry standard for this discipline is Overall Equipment Effectiveness, or OEE, which combines all three factors into a single actionable score. This equipment performance analysis guide covers the frameworks, data collection methods, validation protocols, and improvement strategies that maintenance managers need to move from raw machine data to measurable operational gains. Tools like the Six Big Losses framework and qualification phases IQ, OQ, and PQ form the structural backbone of any credible analysis programme.
What are the essential metrics for equipment performance analysis?
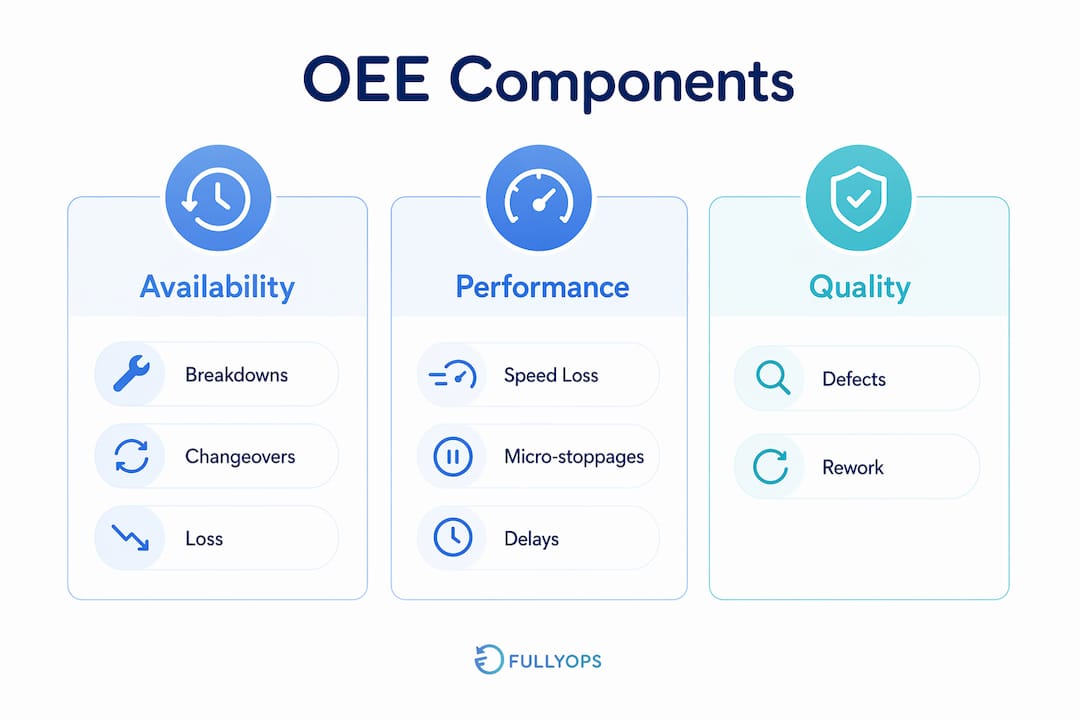
OEE is defined as the product of three components: Availability, Performance, and Quality. Availability measures the proportion of scheduled time a machine is actually running. Performance measures how fast it runs relative to its rated speed. Quality measures the proportion of output that meets specification on the first pass. A world-class OEE score is generally cited at 85%, though most facilities operate between 40% and 60% when losses are measured honestly.
The Six Big Losses framework maps directly onto these three OEE components and gives maintenance teams a structured vocabulary for diagnosing problems.
Losses mapped to OEE components:
- Availability losses: Unplanned breakdowns and planned stops such as changeovers and setups
- Performance losses: Minor stoppages and idling events, plus reduced speed or below-rated cycle times
- Quality losses: Defects and rework during steady-state production, and yield losses during startup
Understanding which loss category is dominant in your facility is the first analytical step. Without that diagnosis, improvement efforts scatter across too many fronts and produce no measurable result.
OEE Component Comparison
| OEE Component | Loss Category | Typical Cause |
|---|---|---|
| Availability | Breakdowns, changeovers | Unplanned failures, long setups |
| Performance | Minor stoppages, speed loss | Jams, worn parts, operator pace |
| Quality | Defects, startup scrap | Process drift, incorrect settings |
One common misuse of OEE is treating it as a ranking metric rather than a diagnostic tool. That approach tells you who is performing poorly but not why. Benchmarking should focus on understanding root causes and learning from comparable operations, not simply comparing percentages between sites or shifts.
Pro Tip: Never compare OEE scores between machines with different product mixes or scheduled run times. The number only has meaning in context of the specific asset and its operating conditions.
How to collect accurate data for equipment reliability evaluation
Accurate data collection is the single most difficult part of any equipment reliability evaluation. The reason is that machine speed losses are largely invisible in routine shift logs. Operators record planned stops and major breakdowns, but brief interruptions of under five minutes rarely make it onto a paper log.

These brief interruptions are called micro-stoppages. They are defined as interruptions lasting seconds to under five minutes, and they account for 10–30% of total lost time per shift. That figure is significant. A facility losing 20% of shift time to micro-stoppages and recording none of it is working with a fundamentally misleading OEE score.
The practical method for capturing these losses is a structured observation study. Follow this sequence:
- Select the target machine. Focus on the bottleneck asset first, since its availability sets the ceiling for the entire line.
- Prepare a tally sheet. Create columns for each loss category: jams, sensor faults, operator absence, material feed issues, and so on.
- Conduct a two-hour stopwatch observation. Stand at the machine and record every interruption, however brief, with its start time, duration, and apparent cause.
- Aggregate and categorise. Total the time lost per category and express each as a percentage of the observation window.
- Repeat across shifts. A single observation captures one shift’s pattern. Two or three observations across different shifts reveal systemic versus operator-specific losses.
Automated OEE tracking systems identify 5–15% improvement opportunities by detecting micro-stoppages that manual logging misses entirely. The investment in sensor-based data capture pays back quickly when the alternative is making improvement decisions on incomplete data.
When aggregating OEE across multiple assets or lines, use throughput-weighted averages rather than simple averages. A simple average of five machines gives equal weight to a low-volume asset and a high-volume bottleneck. That distorts the picture. Weight each machine’s OEE by its throughput contribution, and the aggregate score reflects operational reality.
Pro Tip: If you cannot yet invest in automated tracking, run a two-hour observation study on your top three loss contributors before your next planning cycle. The data quality will exceed six months of manual log entries.
What are best practices for equipment validation and qualification?
Equipment qualification is the formal process of demonstrating that a machine is installed correctly, operates within defined parameters, and consistently produces output that meets specification. In regulated industries such as pharmaceuticals, medical devices, and semiconductor manufacturing, this process follows a defined sequence: Installation Qualification (IQ), Operational Qualification (OQ), and Performance Qualification (PQ).
Each phase has a distinct purpose:
- IQ confirms that the equipment is installed according to manufacturer specifications, utilities are correctly connected, and all components are present and undamaged.
- OQ verifies that the equipment operates correctly across its defined parameter range. This phase requires worst-case testing at upper and lower parameter boundaries, not just at standard operating points. Testing only at nominal settings proves nothing about robustness under stress.
- PQ demonstrates that the equipment consistently produces conforming output under actual production conditions, using real materials and operators.
Each phase requires pre-approved test protocols and final summary reports to satisfy FDA and EU GMP standards. Skipping the pre-approval step or writing protocols after testing is complete are the two most common compliance failures in validation audits.
Documentation quality matters as much as documentation volume. Right-sized records that evidence test purpose, results, and deviation handling are more defensible than thick binders of redundant paperwork. More pages do not equal better validation. Clear, concise records that an auditor can follow without assistance are the standard to aim for.
The goal of equipment qualification is not to generate paperwork. It is to create a documented, reproducible record that the equipment performs as intended under defined conditions. Every test and every record should serve that purpose directly.
A common mistake in OQ is testing only at the nominal operating point. If your equipment’s temperature range is 60°C to 80°C, you must test at 60°C and at 80°C, not just at 70°C. Failure to test at boundaries leaves the qualification scientifically incomplete and vulnerable to regulatory challenge.
How to interpret performance data and drive continuous improvement
Interpreting OEE and Six Big Loss data correctly requires resisting the temptation to fix everything at once. Focusing on one loss category at a time produces measurable gains. Attempting to address multiple categories simultaneously typically results in no improvement, because resources and attention are divided before any single intervention has time to take effect.
Follow this structured interpretation and improvement sequence:
- Rank your Six Big Losses by total time impact. Use your OEE data to calculate the total minutes lost per shift to each category over a representative period of two to four weeks.
- Select the dominant loss category. The largest single contributor is your starting point, regardless of how tempting other problems appear.
- Identify root causes within that category. Use a simple cause-and-effect analysis or a five-why exercise focused specifically on that loss type.
- Design and implement one targeted intervention. For changeover losses, this might mean a single-minute exchange of die (SMED) workshop. For micro-stoppages, it might mean a sensor recalibration or a feed mechanism redesign.
- Measure the result over four weeks. Compare the post-intervention OEE score and the specific loss category total against the baseline. Document the change.
- Move to the next dominant loss category. Only after the first intervention is stable and measured should you shift focus.
A practical example: a packaging line with an OEE of 52% might show that 18% of scheduled time is lost to changeovers, 12% to minor stoppages, and 8% to speed loss. The correct starting point is changeover reduction, not a simultaneous attack on all three. Reducing changeover time from 45 minutes to 25 minutes on a line running three product changes per shift adds roughly one hour of productive time per shift. That single intervention can lift OEE by 6–8 percentage points before any other change is made.
Pro Tip: Track your preventive maintenance schedule alongside your OEE data. Assets with irregular PM compliance almost always show elevated breakdown and minor stoppage losses. The correlation is rarely coincidental.
Key takeaways
Effective equipment performance analysis requires structured frameworks, disciplined data collection, and a deliberate focus on one loss category at a time to produce measurable operational gains.
| Point | Details |
|---|---|
| OEE as a diagnostic tool | Use OEE to identify root causes of loss, not to rank assets or compare sites. |
| Capture micro-stoppages deliberately | Manual logs miss 10–30% of shift losses; structured observation or automation is required. |
| Follow IQ, OQ, PQ in sequence | Each qualification phase requires pre-approved protocols and worst-case testing to be defensible. |
| Prioritise one loss category | Targeting the dominant Six Big Loss category before moving on produces faster, measurable gains. |
| Weight OEE by throughput | Use throughput-weighted averages when aggregating OEE across multiple assets to avoid distortion. |
Why most facilities are measuring the wrong things
After working with maintenance teams across a range of industrial environments, the pattern I see most often is not a lack of data. It is an excess of data that nobody trusts. Shift logs exist, OEE spreadsheets exist, and maintenance records exist. But when you ask a maintenance manager whether their OEE score reflects reality, the honest answer is usually no.
The root cause is almost always micro-stoppage blindness. Teams measure what is easy to record, which means planned stops and major breakdowns. The 15 minutes of cumulative jam clearances per shift never make it onto the log. The result is an OEE score that looks reasonable on paper but masks the actual loss profile entirely.
My advice is to treat your first structured observation study as an audit of your measurement system, not just your equipment. If the losses you observe in two hours do not match what your logs show, the logs are wrong. Fix the measurement before you fix the machine.
The second pattern I see is OEE being used to compare shifts or operators, which creates defensiveness and data manipulation rather than honest reporting. OEE is a diagnostic instrument. The moment it becomes a performance scorecard for people, the data quality collapses. Protect the integrity of the measurement by keeping it focused on the asset, not the team.
For maintenance managers considering asset tracking approaches to support their analysis, the technology is genuinely useful, but only after the measurement discipline is in place. Automating a broken measurement system produces bad data faster.
— Pedro
How Fullyops supports equipment performance analysis in practice
Fullyops is a field service and asset management platform built for maintenance managers who need real-time visibility into equipment status, work order progress, and operational performance. The platform’s operations analytics module centralises OEE-relevant data, including intervention records, technician hours, and asset downtime, into a single dashboard that removes the manual aggregation step entirely. For teams moving from paper logs to digital tracking, Fullyops provides the structure needed to capture micro-stoppages, link them to work orders, and build a reliable performance baseline over time. Explore the resource allocation tutorial to see how Fullyops helps maintenance teams allocate technician time and asset resources more effectively alongside their performance analysis workflows.
FAQ
What is OEE and why does it matter for equipment analysis?
OEE, or Overall Equipment Effectiveness, measures the percentage of scheduled production time that is truly productive, combining availability, performance rate, and quality yield into a single score. It is the standard metric for identifying and quantifying equipment losses in industrial operations.
How do i identify micro-stoppages that manual logs miss?
Conduct a two-hour stopwatch observation study at the target machine, recording every interruption with its duration and cause on a tally sheet. Automated sensor-based tracking systems can also detect these losses continuously and flag patterns that observation studies might miss.
What is the difference between OQ and PQ in equipment qualification?
Operational Qualification (OQ) verifies that equipment functions correctly across its defined parameter range, including at worst-case boundaries. Performance Qualification (PQ) confirms that the equipment consistently produces conforming output under real production conditions with actual materials and operators.
How often should equipment performance metrics be reviewed?
Performance metrics should be reviewed at minimum weekly for active production assets, with a deeper root cause review monthly. Assets showing declining OEE trends warrant immediate investigation rather than waiting for a scheduled review cycle.
Should OEE scores be compared between different machines or sites?
OEE scores should not be used as a direct ranking tool between assets with different product mixes, scheduled run times, or operational contexts. Benchmarking is most useful as a learning exercise to understand root causes, not as a competitive scorecard between facilities.
Recommended
- Maintenance best practices: Boost efficiency and asset life
- Corrective maintenance steps: a guide for operations managers
- Boost efficiency with maintenance auditing: a complete guide