TL;DR:
- Monitoring machine downtime is essential for revealing unplanned losses and improving overall equipment effectiveness. Using structured data collection and analysis, operations teams can identify top failure causes and implement targeted maintenance strategies, reducing downtime by up to 25%. Starting with simple tools like spreadsheets and reason codes enables quick gains and sets the foundation for more advanced systems.
Machine downtime monitoring is the continuous tracking and categorisation of production stoppages to convert equipment losses into decisions that protect output and reduce costs. For operations managers and maintenance professionals, understanding why monitor machine downtime is not an abstract question. Manufacturers lose between 5% and 20% of productive capacity to unplanned stoppages. That figure represents real revenue, real labour waste, and real competitive disadvantage. The industry term for the broader discipline is Overall Equipment Effectiveness (OEE) management, and downtime monitoring is its most critical input. Without it, maintenance decisions rely on memory and guesswork rather than data.
Why monitor machine downtime in manufacturing operations?
Downtime monitoring gives operations teams the factual basis to act, not just react. When a machine stops unexpectedly, the cost is immediate: idle operators, missed delivery windows, and cascading delays across the production line. Predictive maintenance reduces unplanned downtime by up to 50% and cuts total maintenance costs by 18–25%. That is not a marginal gain. It is the difference between a facility that controls its schedule and one that is controlled by its failures.

The importance of machine uptime extends beyond individual machines. A single bottleneck asset running at reduced availability can constrain the entire line. Monitoring creates visibility at the machine level, which allows managers to identify which assets carry the most risk and allocate maintenance resources accordingly. Without that visibility, every machine looks equally healthy until it fails.
Downtime monitoring also creates accountability. When stoppages are recorded, categorised, and reviewed, teams can distinguish between a one-off failure and a recurring pattern. That distinction is what separates reactive firefighting from planned, preventive maintenance.
What are the main causes of machine downtime?
Planned vs unplanned stoppages
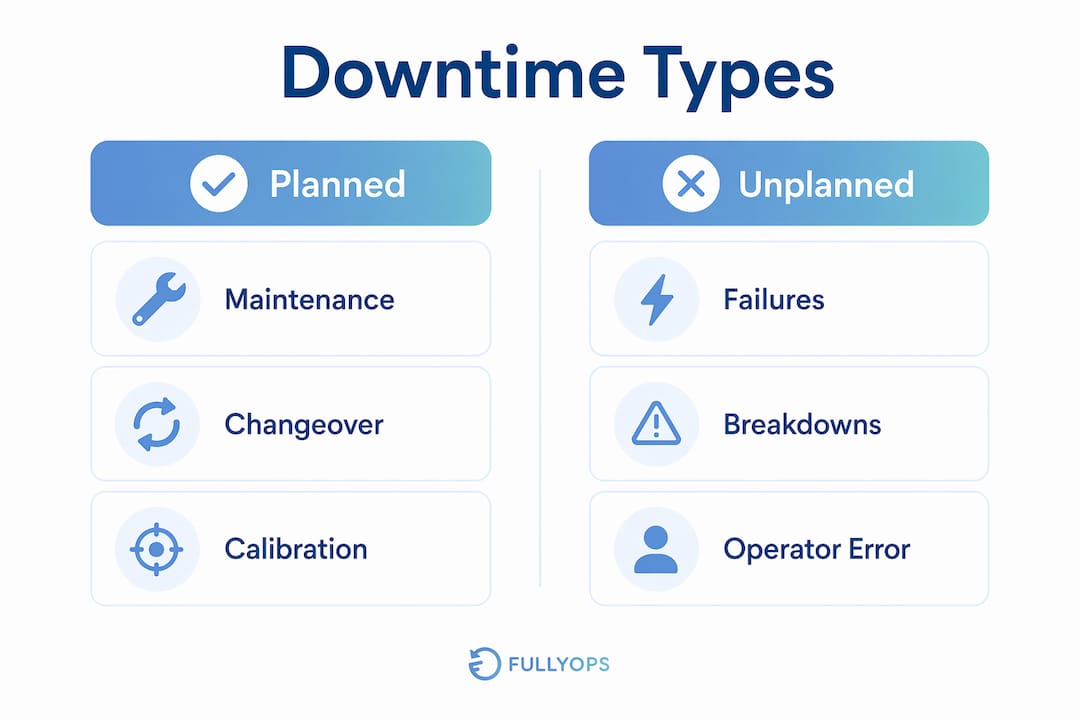
Downtime divides into two categories: planned and unplanned. Planned downtime includes scheduled maintenance, changeovers, and calibration. Unplanned downtime covers unexpected equipment failures, process faults, and material shortages. Both affect OEE, but they require different responses. ISO 22400 KPI standards specify planned and unplanned categories along with detailed root cause classifications for downtime reporting. Using a recognised standard from the outset prevents inconsistent data that cannot be compared across shifts or sites.
Common root causes
The most frequent causes of unplanned stoppages in industrial settings include:
- Equipment failure: Bearing wear, seal degradation, and electrical faults are the leading mechanical causes.
- Process problems: Incorrect parameters, tooling wear, and quality rejects that halt production.
- Material shortages: Missing components or raw materials that idle machines mid-run.
- Operator-related stops: Incorrect setup, missing instructions, or inadequate training.
- Upstream or downstream flow losses: A stoppage on one machine that starves or blocks adjacent equipment.
The 80/20 rule applies directly to downtime causes: 80% of total lost time typically originates from 20% of root issues. Carolina Precision demonstrated this in practice, achieving $1.5 million in savings and 688 additional operating hours per machine after implementing automated downtime tracking and focusing on its primary failure modes. Focusing monitoring efforts on the top causes delivers disproportionate returns.
Pro Tip: Build a Pareto chart from your first 30 days of downtime data. The top three causes will almost always account for more than half of your total lost time. Address those before expanding the scope of your monitoring programme.
How do industrial operations track machine downtime effectively?
Manual vs automated tracking
Operations teams typically begin with manual tracking: operators record stoppages on paper or in spreadsheets, noting the time, duration, and cause. Manual methods are low cost and easy to start, but they depend entirely on operator discipline and introduce transcription errors. Automated tracking uses machine signals, PLC outputs, or clip-on current sensors to detect stoppages without human input. Clip-on sensors enable monitoring of legacy equipment without PLC integration, which makes automation accessible even in older facilities.
| Tracking Method | Cost | Accuracy | Setup Complexity | Best For |
|---|---|---|---|---|
| Paper logs | Low | Low | None | Initial pilots, simple lines |
| Spreadsheets | Low | Medium | Low | Small teams, single shifts |
| Clip-on sensors | Medium | High | Low | Legacy machines, quick deployment |
| PLC integration | High | Very high | High | New equipment, complex lines |
| Full OEE software | High | Very high | High | Multi-site, data-driven operations |
Automated systems also address a technical challenge that manual tracking cannot: debounce thresholds. Incorrect debounce settings skew OEE data accuracy significantly. A debounce threshold is a minimum duration filter applied to machine signals. Without it, a two-second sensor fluctuation registers as a downtime event, inflating stoppage counts and distorting analysis. Configuring this correctly is a step many teams overlook during initial setup.
The role of reason coding
Capturing that a machine stopped is only the first step. Capturing why it stopped is what makes the data useful. Single-level reason coding leads to vague and unusable data. A two-level hierarchy, combining department and specific root cause, gives maintenance teams the precision needed to act. For example, “Mechanical” as a top-level code and “Bearing failure, Machine 4” as the second level produces a work order. “Mechanical” alone produces nothing.
Pro Tip: Limit your reason code list to 10–15 options per machine type. Too many codes create decision fatigue for operators and result in miscategorisation. Fewer, well-defined codes produce cleaner data.
What are the benefits of monitoring machine downtime?
Tracking production efficiency through downtime data produces measurable outcomes across maintenance, operations, and finance. The core benefits are:
- Faster fault detection: 24/7 monitoring lowers Mean Time to Detect and Mean Time to Resolve outages. Faster detection means shorter stoppages and lower revenue loss per incident.
- Reduced repeat failures: When root causes are recorded and addressed, the same fault is less likely to recur. Automated downtime tracking software reduces unplanned downtime by 15–25% within 6–12 months through faster response and repeat failure reduction.
- Improved maintenance planning: Downtime trends reveal which assets need preventive maintenance scheduling adjustments. A machine that stops every three weeks for the same reason is telling you its service interval is wrong.
- Better resource allocation: Knowing which machines generate the most downtime allows managers to direct technician time, spare parts stock, and capital investment where the return is highest.
- Accurate OEE reporting: Misclassifications can falsely inflate availability and mislead maintenance investments. Clean downtime data produces honest OEE figures that reflect actual performance.
The financial case is direct. A facility running at 80% OEE that improves to 85% through downtime reduction does not need new equipment to increase output. It recovers capacity it already owns. For operations managers evaluating ways to reduce equipment downtime, monitoring is the prerequisite for every other improvement method.
What best practices turn downtime data into continuous improvement?
Collecting downtime data is straightforward. Converting it into sustained operational improvement requires a structured process and consistent team behaviour.
- Establish a daily review cycle. Review the previous shift’s downtime data every morning. Identify any new or recurring causes. Assign a corrective action before the next shift begins. Short review cycles prevent small problems from becoming large ones.
- Share root cause analysis transparently. Post downtime summaries where operators and technicians can see them. Factories with visible improvements maintain 92% compliance with data entry versus 54% in facilities where data disappears into management reports. Transparency creates motivation to record accurately.
- Separate planned stoppages from availability losses. Data integrity depends on clearly excluding planned stops and upstream or downstream flow losses from availability calculations. Including them inflates downtime figures and misdirects improvement efforts.
- Run weekly trend reviews. Daily reviews catch acute problems. Weekly reviews reveal patterns: a machine that stops briefly three times per week is a different problem from one that stops for two hours once a month, even if total lost time is similar.
- Conduct monthly improvement planning. Use monthly data to prioritise the top three downtime causes for the following period. Assign ownership, set targets, and review outcomes at the next monthly session.
Pro Tip: Avoid the common trap of treating downtime monitoring as a reporting exercise. Downtime monitoring must be an active tool for ongoing improvement. If your data is not generating work orders or maintenance schedule changes, the programme is not working.
Cultural adoption matters as much as technology. Operators who understand that downtime data leads to fixes, not blame, record more accurately and flag problems earlier. That shift in behaviour is often worth more than any sensor upgrade.
Key takeaways
Monitoring machine downtime is the foundation of effective OEE management, and without structured tracking, maintenance decisions remain reactive and costly.
| Point | Details |
|---|---|
| Downtime monitoring is foundational | Manufacturers lose 5–20% of productive capacity without it; monitoring converts that loss into recoverable output. |
| Categorise causes precisely | Use two-level reason codes aligned with ISO 22400 to produce data that generates specific corrective actions. |
| Automate where possible | Clip-on sensors and OEE software reduce human error and enable 24/7 detection, cutting unplanned stoppages by 15–25%. |
| Close the loop daily | Daily reviews and transparent sharing of root causes maintain operator compliance and drive continuous improvement. |
| Start simple, then scale | Begin with spreadsheets or basic sensors to build data culture before investing in complex integrated systems. |
The case for starting before you are ready
I have worked with operations teams that delayed downtime monitoring for months because they were waiting for the right software, the right sensors, or the right moment to train staff. In nearly every case, the delay cost more than the imperfect start would have. 71% of successful programmes began simply before adopting integrated software. A spreadsheet with consistent reason codes, reviewed every morning, will outperform a sophisticated system that nobody uses correctly.
The second mistake I see repeatedly is treating reason codes as an afterthought. Teams spend weeks selecting sensors and configuring dashboards, then assign a single-level code list in an afternoon. The result is data that shows how much time was lost but not why, which makes it nearly useless for proactive maintenance planning. Reason code design deserves as much attention as hardware selection.
The third point is one that does not appear in most guides: downtime monitoring changes team dynamics. When stoppages are visible and attributed, conversations shift from “the machine broke again” to “bearing failures on Line 3 account for 40% of our lost time this month.” That specificity is what allows maintenance managers to make the case for capital investment, headcount, or schedule changes. The data becomes a management tool, not just a maintenance record.
My honest recommendation is to start this week with whatever tools you have. Pick five machines, define ten reason codes, and review the data every morning for 30 days. The patterns you find will tell you exactly where to invest next.
— Pedro
How Fullyops supports downtime reduction in practice
Fullyops is built for operations teams that want to move from reactive maintenance to planned, data-driven asset management. The platform connects work order management directly to downtime events, so a recorded stoppage can trigger a digital work order, assign a technician, and log resolution time without manual handoffs. For managers looking to build a structured monitoring programme, the Fullyops resource allocation tutorial covers how to align technician capacity with asset criticality. Teams managing multiple sites or legacy equipment will also find value in the asset management systems overview, which maps different system types to operational scale and complexity.
FAQ
What is machine downtime monitoring?
Machine downtime monitoring is the structured tracking and categorisation of production stoppages to identify root causes and reduce lost capacity. It feeds directly into OEE calculations and maintenance planning.
How much productive capacity does unplanned downtime typically cost?
Manufacturers lose between 5% and 20% of productive capacity to unplanned downtime. Predictive maintenance programmes can reduce that figure by up to 50%.
What is the difference between planned and unplanned downtime?
Planned downtime covers scheduled maintenance, changeovers, and calibration. Unplanned downtime covers unexpected failures and process faults. Both affect OEE but require separate tracking and different corrective responses.
How do you start tracking machine downtime without expensive software?
Begin with a spreadsheet and a defined list of 10–15 reason codes per machine type. Review data daily and assign corrective actions. Most successful monitoring programmes started this way before scaling to automated systems.
Why does reason coding matter in downtime tracking?
Single-level reason codes produce vague data that cannot drive specific maintenance actions. Two-level hierarchical coding, combining department and root cause, generates the precision needed to assign work orders and target recurring failures.
Recommended
- Work Order Management Process to Reduce Downtime
- Maintenance scheduling guide to optimise asset uptime
- Role of CMMS in Maintenance – Powering Proactive Uptime