

TL;DR:
- An asset criticality matrix ranks facility assets by failure risk and assigns tiers to guide maintenance priorities. It multiplies consequence severity by failure likelihood, sometimes including detectability, to produce a score for each asset. The matrix enables focused condition monitoring, smarter spares, and risk-based decision-making aligned with standards like ISO 55001.
A matriz de criticidade (asset criticality matrix) ranks every asset in your facility by the risk its failure poses, then assigns each one a tier that drives your maintenance strategy. If you are starting from scratch, take three steps now: (1) list every asset in scope, (2) agree on your consequence categories (safety, environment, production, quality, cost), and (3) choose a scoring scale of 1–5 or 1–10 and lock it before you score a single asset. The full step-by-step method is in Section 5.
Table of Contents
- What a criticality matrix is and how it works
- Why asset criticality analysis matters for operations
- How classification levels map to maintenance strategy
- How to build a criticality matrix step by step
- Worked example: scoring a centrifugal pump
- Translating criticality tiers into maintenance decisions
- Practical implementation in the UK: timeline, roles, and governance
- Good practices and common pitfalls
- How a CMMS accelerates the matrix from score to work order
- Key takeaways
- The case for starting small and validating fast
- Fullyops helps you operationalise your criticality programme
- Useful sources and standards
- FAQ
What a criticality matrix is and how it works
An asset criticality matrix is a semi-quantitative scoring tool that multiplies consequence severity by failure likelihood to produce a criticality score for each asset, which is then mapped to a tier that determines the appropriate maintenance approach.
The standard two-factor formula is:
Criticality = Consequence × Likelihood
Advanced practitioners extend this by adding a detectability factor, giving:
Criticality = Consequence × Likelihood × Detectability
This mirrors the Risk Priority Number structure used in FMEA and is particularly useful when two assets share similar scores but differ significantly in how quickly a developing fault can be detected.
Three terms you will use throughout the analysis:
- Probability (Likelihood): how often the asset is expected to fail within a defined period, scored on a consistent numerical scale.
- Consequence (Severity): the weighted sum of impacts across multiple categories (safety, environment, production, quality, maintenance cost), where weights must total 100%.
- Criticality: the aggregate score that combines both factors and determines the asset’s classification tier.
Why asset criticality analysis matters for operations
The practical case for building a criticality matrix is straightforward: without one, maintenance budgets are allocated by habit, not by risk. Organisations that link criticality to condition-based monitoring and spares policies reduce unnecessary preventive maintenance tasks and concentrate condition monitoring where failure consequences are highest.
Specific benefits include:
- Prioritised PM and CBM investment: time-based tasks are reserved for assets where the cost of failure justifies them; low-criticality assets move to run-to-failure.
- Smarter spares strategy: inventory levels and lead times are set by tier, not by gut feel.
- Scoped RCM and FMEA workstreams: the matrix is the prerequisite to RCM and FMEA; without a validated criticality hierarchy, preventive programmes risk misallocating effort across hundreds of assets.
- Improved safety and environmental focus: consequence categories force explicit scoring of safety and environmental impact, making those risks visible in the maintenance plan.
- Governance alignment: the matrix provides the evidence base required under ISO 55001 for demonstrating risk-based decision-making in asset management.
How classification levels map to maintenance strategy
Most programmes use either a three-tier (A/B/C) or four-tier (Low/Medium/High/Critical) system. The choice depends on the complexity of your asset base and the granularity your maintenance planning system can handle. Simpler sites often find three tiers sufficient; larger facilities with hundreds of assets benefit from the additional resolution of four tiers.
One important rule of thumb: if an asset scores at the maximum severity level in any single category (particularly safety or environment), it should be classified at the top tier regardless of its aggregate score. A single catastrophic safety consequence overrides a low likelihood.
| Class | Score range (indicative) | Typical maintenance approach | Spares policy |
|---|---|---|---|
| A / Critical | Top 10–20% of scores | Condition-based monitoring (CBM), full RCM analysis | On-site critical spares, short lead times |
| B / Important | Next 30–40% | Structured time-based PM, periodic inspection | Agreed stock levels, supplier framework |
| C / Non-critical | Remaining majority | Run-to-failure or minimal PM | Order on demand |
- A/Critical assets justify the highest investment: vibration analysis, thermography, oil sampling, and dedicated RCM studies.
- B/Important assets receive scheduled preventive tasks at defined intervals, with periodic condition checks.
- C/Non-critical assets are maintained reactively; over-maintaining them wastes budget that should flow to A-tier equipment.
How to build a criticality matrix step by step
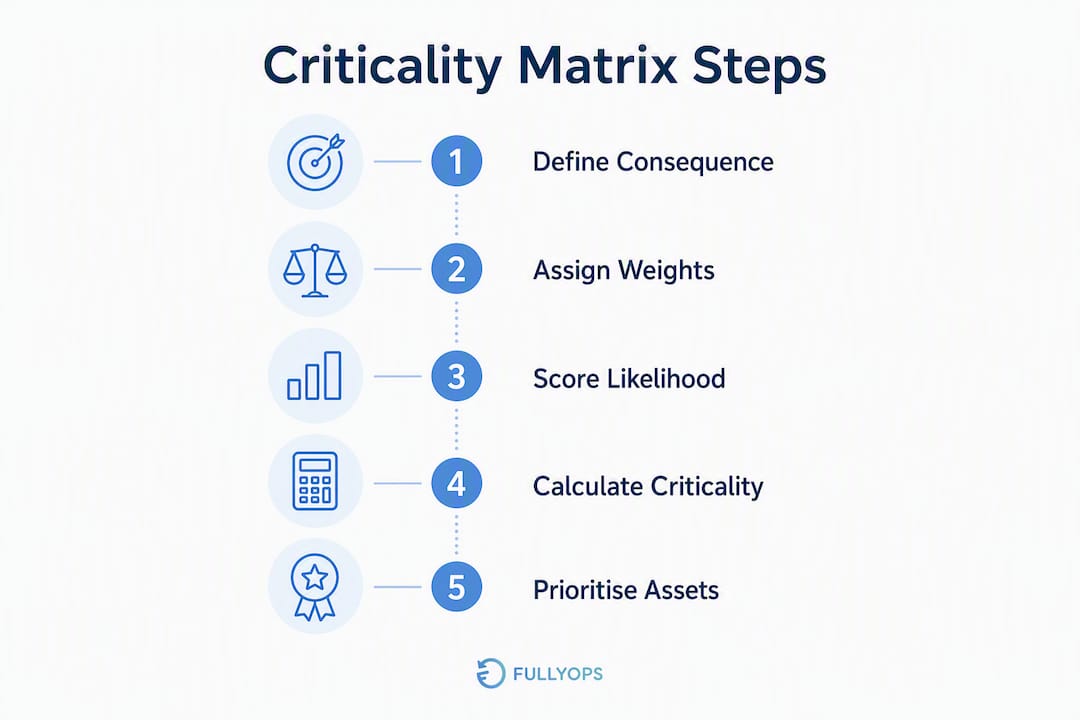
The short recipe: scope your assets, define and weight consequence categories, pick a scoring scale, source likelihood data, calculate scores, and assign tiers. Six steps in practice:
- Scope the asset register. Define the system boundary. Include every asset that can cause production loss, safety incidents, or environmental impact if it fails. Exclude consumables and non-maintainable items.
- Define consequence categories. Standard categories are safety, environment, production loss, quality, maintenance cost, and customer impact. Regulated industries often add regulatory compliance. Each category receives a weight; weights must total 100%.
- Assign weights and get sign-off. Weights reflect your organisation’s priorities. A food manufacturer may weight quality and regulatory compliance highest; a power generator may weight production loss and safety. Weights must be approved by operations, maintenance, and (where relevant) finance before scoring begins.
- Choose and lock a scoring scale. Use 1–5 or 1–10 for both consequence severity and likelihood. Document the scale and fix it for the analysis cycle; changing it mid-analysis invalidates comparisons.
- Source likelihood data. Use 3–5 years of CMMS failure history, vibration and oil-analysis trends, asset age relative to design life, and maintenance records. Where historical data is sparse, qualitative analyst judgement guided by MIL-STD and NASA FMECA worksheets is a valid and recognised approach.
- Calculate scores, assign tiers, and validate. Multiply weighted consequence by likelihood for each asset. Sort descending. Apply tier cutoffs. Review any asset where a single category score is at maximum and escalate to top tier if required.
Scoring template (1–5 scale, five categories):
| Consequence category | Weight | Severity score (1–5) | Weighted score |
|---|---|---|---|
| Safety | 30% | — | — |
| Environment | 20% | — | — |
| Production loss | 25% | — | — |
| Quality | 15% | — | — |
| Maintenance cost | 10% | — | — |
| Total consequence | 100% | Sum of weighted scores |
Worked calculation: Multiply total consequence by likelihood score, then apply your tier cutoffs.
Pro Tip: Add a detectability column to your scoring sheet. An asset that scores identically to another on consequence and likelihood but has no early-warning sensor should be treated as higher priority, because failure arrives without notice.

Worked example: scoring a centrifugal pump
The table below shows a complete scoring run for a centrifugal pump on a primary process line, using a 1–5 scale and the five standard categories.
| Consequence category | Weight | Severity (1–5) | Weighted score |
|---|---|---|---|
| Safety | 30% | 3 | — |
| Environment | 20% | 2 | — |
| Production loss | 25% | 5 | — |
| Quality | 15% | 3 | — |
| Maintenance cost | 10% | 2 | — |
| Total consequence | 100% | 3.20 |
Likelihood score: 4 (one to two failures per year based on CMMS history).
Criticality score = 3.20 × 4 = 12.8
With a 1–5 scale, the maximum possible score is 25. A score of 12.8 places this pump in the upper-middle range. If your top-tier cutoff is set at 10 and above, this asset is classified A/Critical and qualifies for CBM and an RCM study.
For a spreadsheet or CMMS import, the minimum columns required are: Asset ID, Asset name, System/location, each consequence category score, consequence weight, total weighted consequence, likelihood score, criticality score, and assigned tier. Exporting this structure as a CSV allows direct import into most CMMS platforms, including Fullyops.
- Production loss scored 5 because a pump failure stops the primary line entirely.
- Safety scored 3 because the fluid is pressurised but not classified as hazardous.
- The likelihood score of 4 reflects documented failure frequency from CMMS records.
Translating criticality tiers into maintenance decisions
Once every asset has a tier, the matrix drives three operational decisions: what maintenance strategy to apply, how to allocate condition-monitoring resources, and what spares to hold.

| Tier | Maintenance strategy | Condition monitoring | Spares policy | RCM/FMEA |
|---|---|---|---|---|
| A / Critical | CBM + structured PM | Continuous or monthly | On-site critical stock | Full RCM study |
| B / Important | Time-based PM | Quarterly inspection | Agreed min/max levels | FMEA on key failure modes |
| C / Non-critical | Run-to-failure | Annual or none | Order on demand | Not required |
A practical example: a critical compressor (Tier A) receives monthly vibration analysis, an on-site bearing and seal kit, and a full RCM study that defines its failure modes and their consequences. A general-purpose ventilation fan (Tier C) runs until it fails; replacement parts are ordered when needed. The difference in annual maintenance spend between these two assets is substantial, and the matrix makes that allocation defensible to finance and operations.
Criticality tiers also determine maintenance scheduling cadence: Tier A assets appear in weekly planning reviews, Tier B in monthly, and Tier C only when a failure or inspection triggers a work order.
The matrix steers RCM and FMEA scope directly. ACA is the prerequisite to both frameworks: RCM operates at the function level and FMEA at the failure-mode level, and both are resource-intensive. Applying them only to top-tier assets keeps the programme proportionate.
Practical implementation in the UK: timeline, roles, and governance
A realistic rollout has four phases. Timelines vary by site size:
- Scoping and data gathering (weeks 1–3 for small sites, weeks 1–6 for large sites). Extract the asset register from your CMMS, confirm system boundaries, and pull 3–5 years of failure history.
- Category definition and weight sign-off (weeks 2–4). Convene maintenance, operations, and procurement. Agree consequence categories, weights, and scoring rules. Document everything before scoring begins.
- Scoring and validation (weeks 3–8). Score assets, calculate criticality, assign tiers. Validate the top 10–20% of scores with asset owners and reliability engineers. Adjust any anomalies.
- Rollout and CMMS integration (weeks 6–12). Tag assets with their tier in the CMMS, configure PM triggers and spares rules, and brief the maintenance team.
Roles and responsibilities:
- Asset owner / operations lead: approves consequence weights and validates tier assignments for their systems.
- Reliability engineer: leads the scoring methodology, manages the scoring sheet, and owns the review cadence.
- Maintenance planner: translates tiers into PM schedules and work-order templates.
- Procurement / stores: adjusts spares holdings based on tier-driven policies.
- Finance sign-off: approves any budget implications arising from tier changes.
For UK sites, the analysis should align with the Health and Safety at Work etc. Act 1974 and relevant statutory inspection requirements (e.g. PSSR 2000 for pressure systems, PUWER 1998 for work equipment). Safety consequence scores must reflect these obligations, not just operational preference.
Review cadence: quarterly for top-tier assets, annual for the full asset base, and an immediate review after any major process change, significant failure, or new equipment installation.
Good practices and common pitfalls
The most frequent mistakes in criticality programmes are not methodological errors — they are governance failures.
- Pitfall: overweighting maintenance cost. Cost is a legitimate category, but giving it a high weight can push high-cost, low-risk assets into Tier A while genuinely dangerous assets sit in Tier B. Weight safety and production loss first.
- Pitfall: inconsistent scoring. Different engineers applying the same scale differently produces unreliable tiers. Fix this with a documented scoring guide that defines what each score means for each category, and run a calibration session before full scoring begins.
- Pitfall: ignoring detectability. Two assets with identical consequence and likelihood scores are not equally risky if one has continuous condition monitoring and the other has none. Add detectability as a third factor or at least flag assets with no early-warning capability.
- Pitfall: infrequent review. A matrix built on three-year-old data is not a risk tool; it is a historical record. Quarterly reviews for top-tier assets and an annual full review are the minimum recommended cadence.
Pro Tip: Lock the consequence weights in a controlled document and require a formal change request to alter them. This prevents ad hoc adjustments that distort tier assignments over time and makes the programme auditable.
Best-practice countermeasures:
- Conduct a sample audit of 10–15% of scored assets each year to check scoring consistency.
- Require dual sign-off (reliability engineer and operations lead) for any Tier A classification.
- Store the scoring sheet in your CMMS or document management system, not in a personal spreadsheet.
- Include spare-parts lead times as part of the consequence scoring for production-critical assets — a long lead time amplifies the production-loss consequence.
How a CMMS accelerates the matrix from score to work order
Digital workflows do not replace the analysis, but they remove the manual overhead that causes programmes to stall after the initial scoring exercise.
A modern asset-management platform supports the full workflow in four steps:
- Import the asset register with criticality scores and tier tags from your CSV template.
- Configure automated work-order triggers based on tier: Tier A assets generate CBM inspection orders on a defined frequency; Tier B assets generate time-based PM orders; Tier C assets generate reactive work orders only.
- Set spares rules by tier: minimum stock levels, reorder points, and preferred suppliers are linked to the asset’s tier in the inventory module.
- Monitor KPIs on a live dashboard: mean time between failures (MTBF), mean time to repair (MTTR), and PM compliance by tier give you the evidence to validate and update scores at each review cycle.
Fullyops supports this workflow directly. Its asset register accepts criticality tier tags, its work order management module generates and assigns tasks automatically based on asset rules, and its operations analytics dashboards track KPIs by asset, team, and site. The platform’s inventory module links spares holdings to asset records, so tier-driven stock rules are enforced without manual intervention. For teams that need condition-based maintenance workflows, Fullyops connects condition triggers to automated work-order generation, closing the loop between the matrix and the maintenance schedule.
Key takeaways
A criticality matrix delivers reliable maintenance prioritisation only when consequence weights are locked, scoring rules are documented, and tiers are connected to automated CMMS workflows.
| Point | Details |
|---|---|
| Standard formula | Criticality = Consequence × Likelihood; weights across consequence categories must total 100%. |
| Tier cutoffs | Top 10–20% of scores = Critical (CBM + RCM); next 30–40% = Important (structured PM); remainder = run-to-failure. |
| Review cadence | Quarterly for top-tier assets; annual for the full asset base; immediate after major process changes. |
| Governance discipline | Lock consequence weights in a controlled document; require dual sign-off for Tier A classifications. |
| Fullyops integration | Fullyops imports criticality tiers, automates work-order triggers by tier, and tracks MTBF/MTTR on live dashboards. |
The case for starting small and validating fast
Most criticality programmes fail not because the methodology is wrong but because the scope is too ambitious at the outset. A team that tries to score 800 assets in one pass typically produces inconsistent results, loses stakeholder confidence, and shelves the matrix within six months.
The more reliable path is a six-to-eight-week pilot covering your top 10–20% most critical assets — the ones where a failure would stop production, trigger a safety incident, or breach a regulatory requirement. Score those assets rigorously, validate the tiers with operations and procurement, and use the results to set spares holdings and CBM schedules before expanding to the full register. Track two metrics during the pilot: PM compliance rate for Tier A assets and the number of unplanned failures on assets that were classified as non-critical. If the second number is higher than expected, your scoring criteria need recalibrating before you scale.
The matrix is not a one-time exercise. Its value compounds as the scoring rules mature, the CMMS data improves, and the team builds confidence in the tiers. Start with a defensible pilot, validate it, and scale from there.
Fullyops helps you operationalise your criticality programme
Maintenance managers who have completed a criticality analysis often hit the same obstacle: translating a spreadsheet of scores into a live, automated maintenance programme. Fullyops removes that gap. The platform’s asset register accepts criticality tier tags directly from your CSV export, and its rule-based resource allocation engine converts those tiers into PM schedules, CBM triggers, and spares rules without manual configuration for each asset.
Three concrete benefits for maintenance managers running a criticality programme:
- Faster pilot: import your top 10–20% critical assets in a single CSV upload and have automated work orders running within days, not weeks.
- Automated PM and CBM triggers: tier-based rules generate and assign work orders on the correct frequency, so the maintenance schedule stays aligned with the matrix without manual updates.
- Clearer spares rules: inventory holdings are linked to asset tiers, so reorder points and minimum stock levels reflect criticality rather than historical habit.
Book a demo with Fullyops to see how the platform maps to your criticality workflow and get a template CSV ready for your first import.
Useful sources and standards
- ISO 55001:2014 — Asset management: management systems: the international standard that requires risk-based decision-making in asset management programmes; the criticality matrix provides the evidence base.
- NASA FMECA guidance: covers qualitative criticality analysis worksheets for situations where quantitative failure-rate data is unavailable; directly applicable to new or data-sparse asset bases.
- USACE Chapter 5: Criticality ranking (quantitative and qualitative): detailed guidance on constructing criticality matrices and interpreting results, including the rationale for prioritising high-severity/low-probability items.
- How to calculate asset criticality (ReliaMag): a practical methodology guide covering weighted scoring, tier cutoffs, and review cadence.
- Gemba Academy: How to use a criticality matrix for FMECA: a visual walkthrough of how the criticality matrix integrates with FMECA workstreams.
- For downloadable CSV/Excel templates, the column structure described in Section 6 (Asset ID, Asset name, System/location, consequence category scores, weights, total weighted consequence, likelihood score, criticality score, tier) can be built directly in Excel or imported into Fullyops. The ReliaMag guide above includes a worked template as a reference.
This article provides general guidance on asset criticality methodology. For safety-critical or regulated applications, confirm your approach against the relevant primary standards (ISO 55001, PSSR 2000, PUWER 1998) and seek advice from a qualified reliability or safety engineer.
FAQ
What is an asset criticality matrix?
An asset criticality matrix is a scoring tool that ranks assets by multiplying consequence severity by failure likelihood, producing a tiered classification that drives maintenance strategy. Each tier maps to a specific approach: condition-based monitoring for critical assets, structured preventive maintenance for important assets, and run-to-failure for non-critical ones.
What are the standard criticality classification levels?
Most programmes use three tiers (A/B/C) or four tiers (Low/Medium/High/Critical). The top tier typically covers the highest 10–20% of scores and qualifies for RCM analysis; the middle tier (next 30–40%) receives structured PM; the remainder follows run-to-failure.
What consequence categories should a criticality matrix include?
Standard categories are safety, environment, production loss, quality, maintenance cost, and customer impact. Regulated industries add regulatory compliance. Weights across all categories must total 100%, and safety and production loss are typically weighted highest.
How does a criticality matrix connect to RCM and FMEA?
The criticality matrix is the prerequisite to both frameworks: it identifies which assets justify the resource investment of an RCM study (function level) or FMEA (failure-mode level). Applying RCM and FMEA only to top-tier assets keeps the programme proportionate and focused.
How often should a criticality matrix be reviewed?
Top-tier assets should be reviewed quarterly; the full asset base annually. An immediate review is required after any major process change, significant failure event, or introduction of new equipment.
Recommended
- Types of asset management systems for maintenance
- reCAPTCHA
- Essential preventive maintenance steps: maximise reliability
- Maintenance best practices: Boost efficiency and asset life